Portuguese vs Immigrants from Chile 6th Grade
COMPARE
Portuguese
Immigrants from Chile
6th Grade
6th Grade Comparison
Portuguese
Immigrants from Chile
96.8%
6TH GRADE
8.2/ 100
METRIC RATING
214th/ 347
METRIC RANK
96.8%
6TH GRADE
14.2/ 100
METRIC RATING
202nd/ 347
METRIC RANK
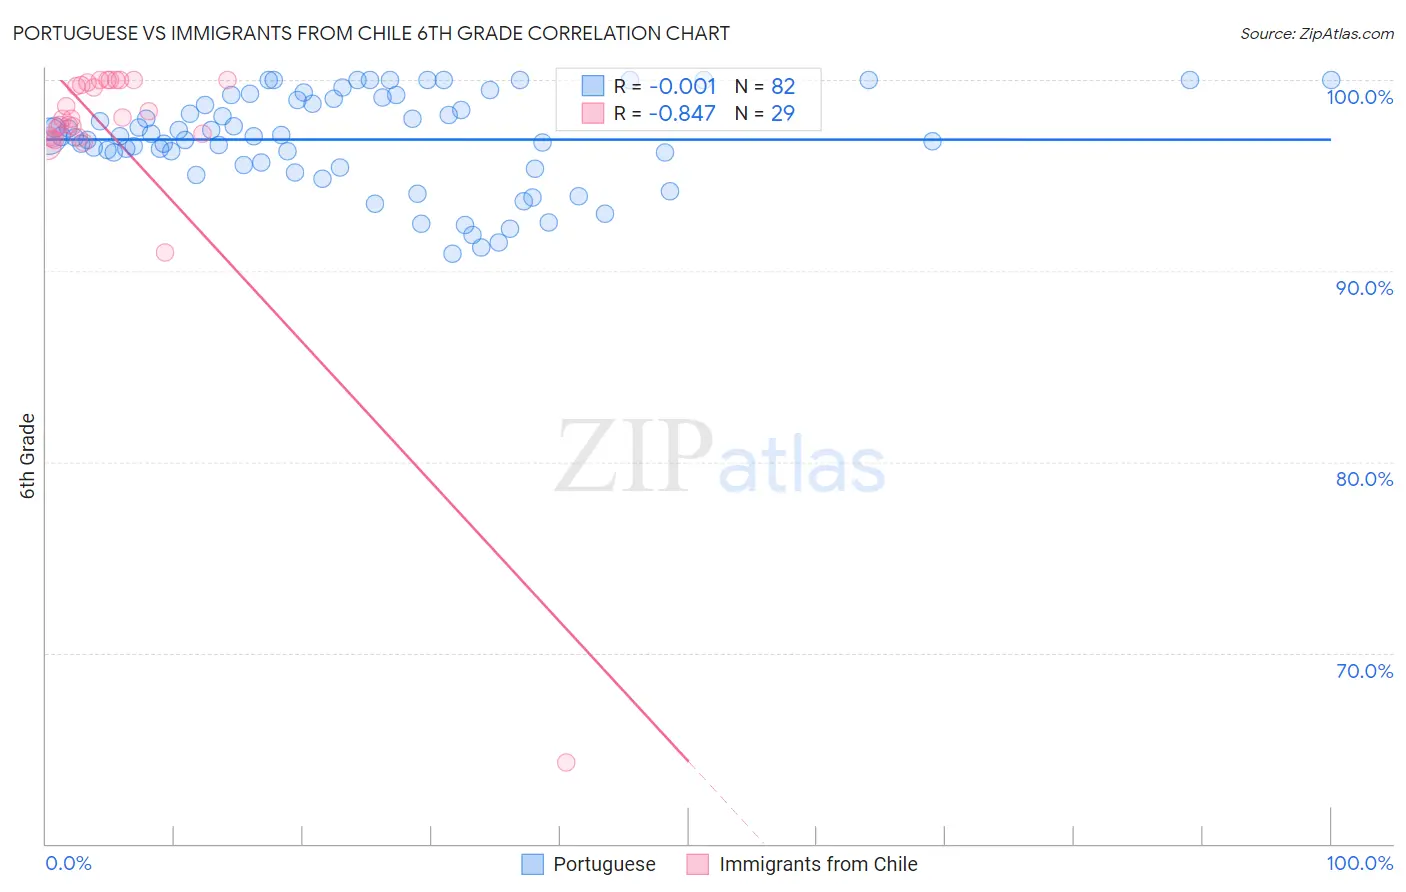
Portuguese vs Immigrants from Chile 6th Grade Correlation Chart
The statistical analysis conducted on geographies consisting of 450,351,764 people shows no correlation between the proportion of Portuguese and percentage of population with at least 6th grade education in the United States with a correlation coefficient (R) of -0.001 and weighted average of 96.8%. Similarly, the statistical analysis conducted on geographies consisting of 218,647,266 people shows a very strong negative correlation between the proportion of Immigrants from Chile and percentage of population with at least 6th grade education in the United States with a correlation coefficient (R) of -0.847 and weighted average of 96.8%, a difference of 0.070%.
6th Grade Correlation Summary
| Measurement | Portuguese | Immigrants from Chile |
| Minimum | 90.9% | 64.3% |
| Maximum | 100.0% | 100.0% |
| Range | 9.1% | 35.7% |
| Mean | 96.9% | 97.0% |
| Median | 97.0% | 98.0% |
| Interquartile 25% (IQ1) | 95.6% | 97.0% |
| Interquartile 75% (IQ3) | 99.0% | 99.9% |
| Interquartile Range (IQR) | 3.4% | 2.9% |
| Standard Deviation (Sample) | 2.5% | 6.6% |
| Standard Deviation (Population) | 2.4% | 6.5% |
Demographics Similar to Portuguese and Immigrants from Chile by 6th Grade
In terms of 6th grade, the demographic groups most similar to Portuguese are Sierra Leonean (96.8%, a difference of 0.0%), Immigrants from Iraq (96.8%, a difference of 0.010%), Moroccan (96.8%, a difference of 0.010%), Immigrants from Sudan (96.8%, a difference of 0.010%), and Paiute (96.8%, a difference of 0.010%). Similarly, the demographic groups most similar to Immigrants from Chile are Immigrants from Zaire (96.9%, a difference of 0.0%), Sudanese (96.8%, a difference of 0.0%), Immigrants from Bahamas (96.8%, a difference of 0.0%), Immigrants from Northern Africa (96.9%, a difference of 0.010%), and African (96.9%, a difference of 0.010%).
| Demographics | Rating | Rank | 6th Grade |
| Immigrants | Albania | 18.8 /100 | #198 | Poor 96.9% |
| Immigrants | Northern Africa | 15.7 /100 | #199 | Poor 96.9% |
| Africans | 14.8 /100 | #200 | Poor 96.9% |
| Immigrants | Zaire | 14.5 /100 | #201 | Poor 96.9% |
| Immigrants | Chile | 14.2 /100 | #202 | Poor 96.8% |
| Sudanese | 13.9 /100 | #203 | Poor 96.8% |
| Immigrants | Bahamas | 13.8 /100 | #204 | Poor 96.8% |
| Natives/Alaskans | 13.0 /100 | #205 | Poor 96.8% |
| Laotians | 11.8 /100 | #206 | Poor 96.8% |
| Iraqis | 11.7 /100 | #207 | Poor 96.8% |
| Samoans | 11.0 /100 | #208 | Poor 96.8% |
| Immigrants | Oceania | 11.0 /100 | #209 | Poor 96.8% |
| Immigrants | Nepal | 10.1 /100 | #210 | Poor 96.8% |
| Immigrants | Iraq | 9.2 /100 | #211 | Tragic 96.8% |
| Moroccans | 9.0 /100 | #212 | Tragic 96.8% |
| Immigrants | Sudan | 8.7 /100 | #213 | Tragic 96.8% |
| Portuguese | 8.2 /100 | #214 | Tragic 96.8% |
| Sierra Leoneans | 8.0 /100 | #215 | Tragic 96.8% |
| Paiute | 7.8 /100 | #216 | Tragic 96.8% |
| Liberians | 7.5 /100 | #217 | Tragic 96.8% |
| Navajo | 7.3 /100 | #218 | Tragic 96.8% |