Pennsylvania German vs Bahamian Kindergarten
COMPARE
Pennsylvania German
Bahamian
Kindergarten
Kindergarten Comparison
Pennsylvania Germans
Bahamians
98.6%
KINDERGARTEN
100.0/ 100
METRIC RATING
20th/ 347
METRIC RANK
97.8%
KINDERGARTEN
6.6/ 100
METRIC RATING
217th/ 347
METRIC RANK
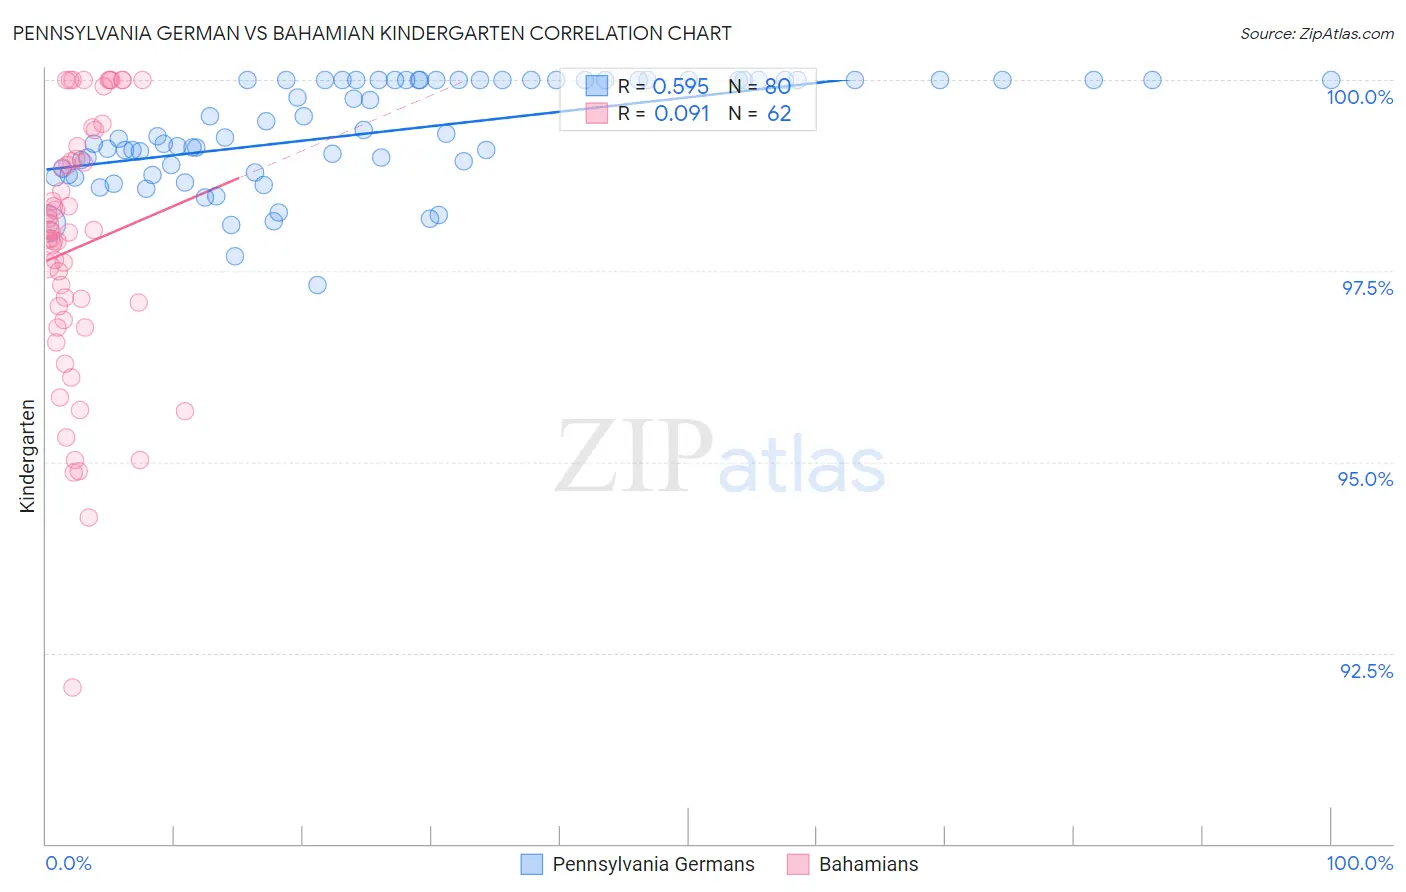
Pennsylvania German vs Bahamian Kindergarten Correlation Chart
The statistical analysis conducted on geographies consisting of 234,102,531 people shows a substantial positive correlation between the proportion of Pennsylvania Germans and percentage of population with at least kindergarten education in the United States with a correlation coefficient (R) of 0.595 and weighted average of 98.6%. Similarly, the statistical analysis conducted on geographies consisting of 112,673,855 people shows a slight positive correlation between the proportion of Bahamians and percentage of population with at least kindergarten education in the United States with a correlation coefficient (R) of 0.091 and weighted average of 97.8%, a difference of 0.88%.
Kindergarten Correlation Summary
| Measurement | Pennsylvania German | Bahamian |
| Minimum | 97.3% | 92.1% |
| Maximum | 100.0% | 100.0% |
| Range | 2.7% | 7.9% |
| Mean | 99.3% | 97.8% |
| Median | 99.3% | 98.0% |
| Interquartile 25% (IQ1) | 98.8% | 96.9% |
| Interquartile 75% (IQ3) | 100.0% | 99.0% |
| Interquartile Range (IQR) | 1.2% | 2.1% |
| Standard Deviation (Sample) | 0.68% | 1.7% |
| Standard Deviation (Population) | 0.68% | 1.7% |
Similar Demographics by Kindergarten
Demographics Similar to Pennsylvania Germans by Kindergarten
In terms of kindergarten, the demographic groups most similar to Pennsylvania Germans are Lithuanian (98.6%, a difference of 0.0%), Finnish (98.6%, a difference of 0.0%), Arapaho (98.6%, a difference of 0.0%), Danish (98.6%, a difference of 0.0%), and Sioux (98.6%, a difference of 0.0%).
| Demographics | Rating | Rank | Kindergarten |
| Carpatho Rusyns | 100.0 /100 | #13 | Exceptional 98.7% |
| English | 100.0 /100 | #14 | Exceptional 98.7% |
| Swedes | 100.0 /100 | #15 | Exceptional 98.7% |
| Aleuts | 100.0 /100 | #16 | Exceptional 98.6% |
| Scottish | 100.0 /100 | #17 | Exceptional 98.6% |
| Dutch | 100.0 /100 | #18 | Exceptional 98.6% |
| Irish | 100.0 /100 | #19 | Exceptional 98.6% |
| Pennsylvania Germans | 100.0 /100 | #20 | Exceptional 98.6% |
| Lithuanians | 100.0 /100 | #21 | Exceptional 98.6% |
| Finns | 100.0 /100 | #22 | Exceptional 98.6% |
| Arapaho | 100.0 /100 | #23 | Exceptional 98.6% |
| Danes | 100.0 /100 | #24 | Exceptional 98.6% |
| Sioux | 100.0 /100 | #25 | Exceptional 98.6% |
| Poles | 100.0 /100 | #26 | Exceptional 98.6% |
| Scotch-Irish | 100.0 /100 | #27 | Exceptional 98.6% |
Demographics Similar to Bahamians by Kindergarten
In terms of kindergarten, the demographic groups most similar to Bahamians are Samoan (97.8%, a difference of 0.0%), South American Indian (97.8%, a difference of 0.010%), Uruguayan (97.8%, a difference of 0.010%), Immigrants from Bahamas (97.8%, a difference of 0.010%), and Moroccan (97.8%, a difference of 0.020%).
| Demographics | Rating | Rank | Kindergarten |
| Immigrants | Oceania | 11.1 /100 | #210 | Poor 97.8% |
| Laotians | 10.5 /100 | #211 | Poor 97.8% |
| Moroccans | 8.9 /100 | #212 | Tragic 97.8% |
| South American Indians | 7.7 /100 | #213 | Tragic 97.8% |
| Uruguayans | 7.5 /100 | #214 | Tragic 97.8% |
| Immigrants | Bahamas | 7.4 /100 | #215 | Tragic 97.8% |
| Samoans | 6.9 /100 | #216 | Tragic 97.8% |
| Bahamians | 6.6 /100 | #217 | Tragic 97.8% |
| Immigrants | Morocco | 5.4 /100 | #218 | Tragic 97.7% |
| Immigrants | Panama | 5.0 /100 | #219 | Tragic 97.7% |
| Tongans | 4.8 /100 | #220 | Tragic 97.7% |
| Immigrants | Zaire | 4.5 /100 | #221 | Tragic 97.7% |
| Immigrants | Sudan | 4.5 /100 | #222 | Tragic 97.7% |
| Immigrants | Syria | 4.3 /100 | #223 | Tragic 97.7% |
| Iraqis | 3.9 /100 | #224 | Tragic 97.7% |