Paiute vs Immigrants from Germany 9th Grade
COMPARE
Paiute
Immigrants from Germany
9th Grade
9th Grade Comparison
Paiute
Immigrants from Germany
94.2%
9TH GRADE
1.9/ 100
METRIC RATING
245th/ 347
METRIC RANK
95.6%
9TH GRADE
98.7/ 100
METRIC RATING
93rd/ 347
METRIC RANK
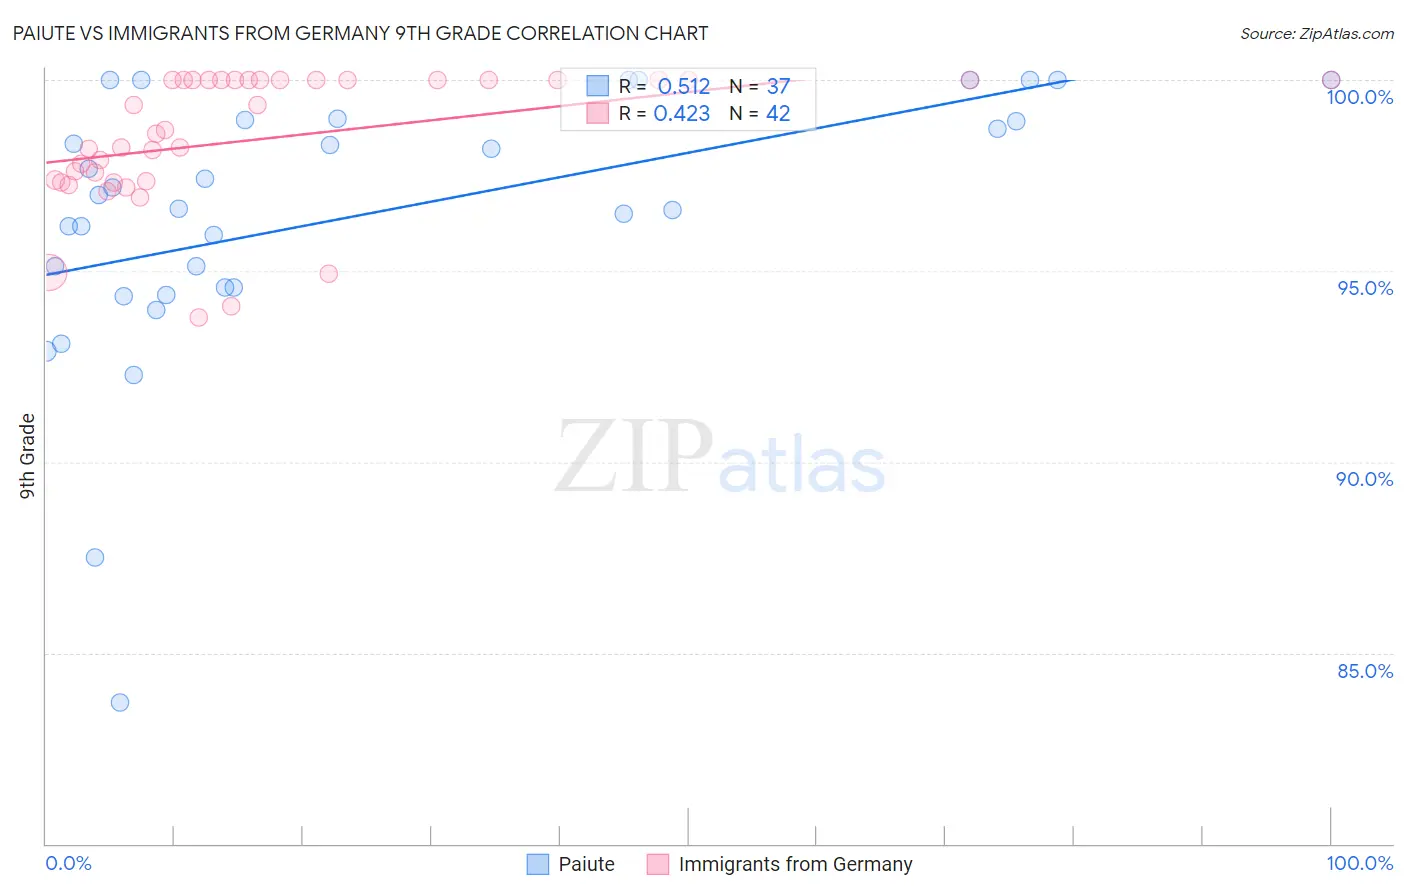
Paiute vs Immigrants from Germany 9th Grade Correlation Chart
The statistical analysis conducted on geographies consisting of 58,403,520 people shows a substantial positive correlation between the proportion of Paiute and percentage of population with at least 9th grade education in the United States with a correlation coefficient (R) of 0.512 and weighted average of 94.2%. Similarly, the statistical analysis conducted on geographies consisting of 463,886,920 people shows a moderate positive correlation between the proportion of Immigrants from Germany and percentage of population with at least 9th grade education in the United States with a correlation coefficient (R) of 0.423 and weighted average of 95.6%, a difference of 1.5%.
9th Grade Correlation Summary
| Measurement | Paiute | Immigrants from Germany |
| Minimum | 83.7% | 93.8% |
| Maximum | 100.0% | 100.0% |
| Range | 16.3% | 6.2% |
| Mean | 96.5% | 98.5% |
| Median | 97.0% | 98.6% |
| Interquartile 25% (IQ1) | 94.6% | 97.3% |
| Interquartile 75% (IQ3) | 99.0% | 100.0% |
| Interquartile Range (IQR) | 4.4% | 2.7% |
| Standard Deviation (Sample) | 3.5% | 1.7% |
| Standard Deviation (Population) | 3.5% | 1.7% |
Similar Demographics by 9th Grade
Demographics Similar to Paiute by 9th Grade
In terms of 9th grade, the demographic groups most similar to Paiute are Senegalese (94.2%, a difference of 0.0%), Dutch West Indian (94.2%, a difference of 0.010%), Afghan (94.2%, a difference of 0.010%), Immigrants from Middle Africa (94.2%, a difference of 0.020%), and Immigrants from Cameroon (94.2%, a difference of 0.020%).
| Demographics | Rating | Rank | 9th Grade |
| South American Indians | 2.8 /100 | #238 | Tragic 94.3% |
| Immigrants | China | 2.8 /100 | #239 | Tragic 94.3% |
| Immigrants | Ethiopia | 2.7 /100 | #240 | Tragic 94.3% |
| Spanish Americans | 2.6 /100 | #241 | Tragic 94.2% |
| Immigrants | Middle Africa | 2.2 /100 | #242 | Tragic 94.2% |
| Immigrants | Cameroon | 2.1 /100 | #243 | Tragic 94.2% |
| Dutch West Indians | 2.0 /100 | #244 | Tragic 94.2% |
| Paiute | 1.9 /100 | #245 | Tragic 94.2% |
| Senegalese | 1.9 /100 | #246 | Tragic 94.2% |
| Afghans | 1.8 /100 | #247 | Tragic 94.2% |
| Immigrants | Somalia | 1.4 /100 | #248 | Tragic 94.1% |
| Uruguayans | 1.3 /100 | #249 | Tragic 94.1% |
| Immigrants | Hong Kong | 1.3 /100 | #250 | Tragic 94.1% |
| Jamaicans | 1.0 /100 | #251 | Tragic 94.1% |
| Immigrants | Senegal | 0.9 /100 | #252 | Tragic 94.1% |
Demographics Similar to Immigrants from Germany by 9th Grade
In terms of 9th grade, the demographic groups most similar to Immigrants from Germany are Immigrants from Latvia (95.6%, a difference of 0.0%), Creek (95.6%, a difference of 0.010%), Immigrants from Saudi Arabia (95.6%, a difference of 0.010%), Yugoslavian (95.7%, a difference of 0.020%), and South African (95.6%, a difference of 0.020%).
| Demographics | Rating | Rank | 9th Grade |
| Immigrants | Western Europe | 99.1 /100 | #86 | Exceptional 95.7% |
| Okinawans | 99.0 /100 | #87 | Exceptional 95.7% |
| Immigrants | Czechoslovakia | 98.9 /100 | #88 | Exceptional 95.7% |
| Yugoslavians | 98.9 /100 | #89 | Exceptional 95.7% |
| South Africans | 98.8 /100 | #90 | Exceptional 95.6% |
| Creek | 98.8 /100 | #91 | Exceptional 95.6% |
| Immigrants | Saudi Arabia | 98.8 /100 | #92 | Exceptional 95.6% |
| Immigrants | Germany | 98.7 /100 | #93 | Exceptional 95.6% |
| Immigrants | Latvia | 98.7 /100 | #94 | Exceptional 95.6% |
| Americans | 98.5 /100 | #95 | Exceptional 95.6% |
| Filipinos | 98.5 /100 | #96 | Exceptional 95.6% |
| Delaware | 98.4 /100 | #97 | Exceptional 95.6% |
| Immigrants | Japan | 98.4 /100 | #98 | Exceptional 95.6% |
| Menominee | 98.3 /100 | #99 | Exceptional 95.6% |
| Lebanese | 98.1 /100 | #100 | Exceptional 95.6% |