Osage vs Ottawa High School Diploma
COMPARE
Osage
Ottawa
High School Diploma
High School Diploma Comparison
Osage
Ottawa
89.1%
HIGH SCHOOL DIPLOMA
48.9/ 100
METRIC RATING
176th/ 347
METRIC RANK
90.1%
HIGH SCHOOL DIPLOMA
94.4/ 100
METRIC RATING
120th/ 347
METRIC RANK
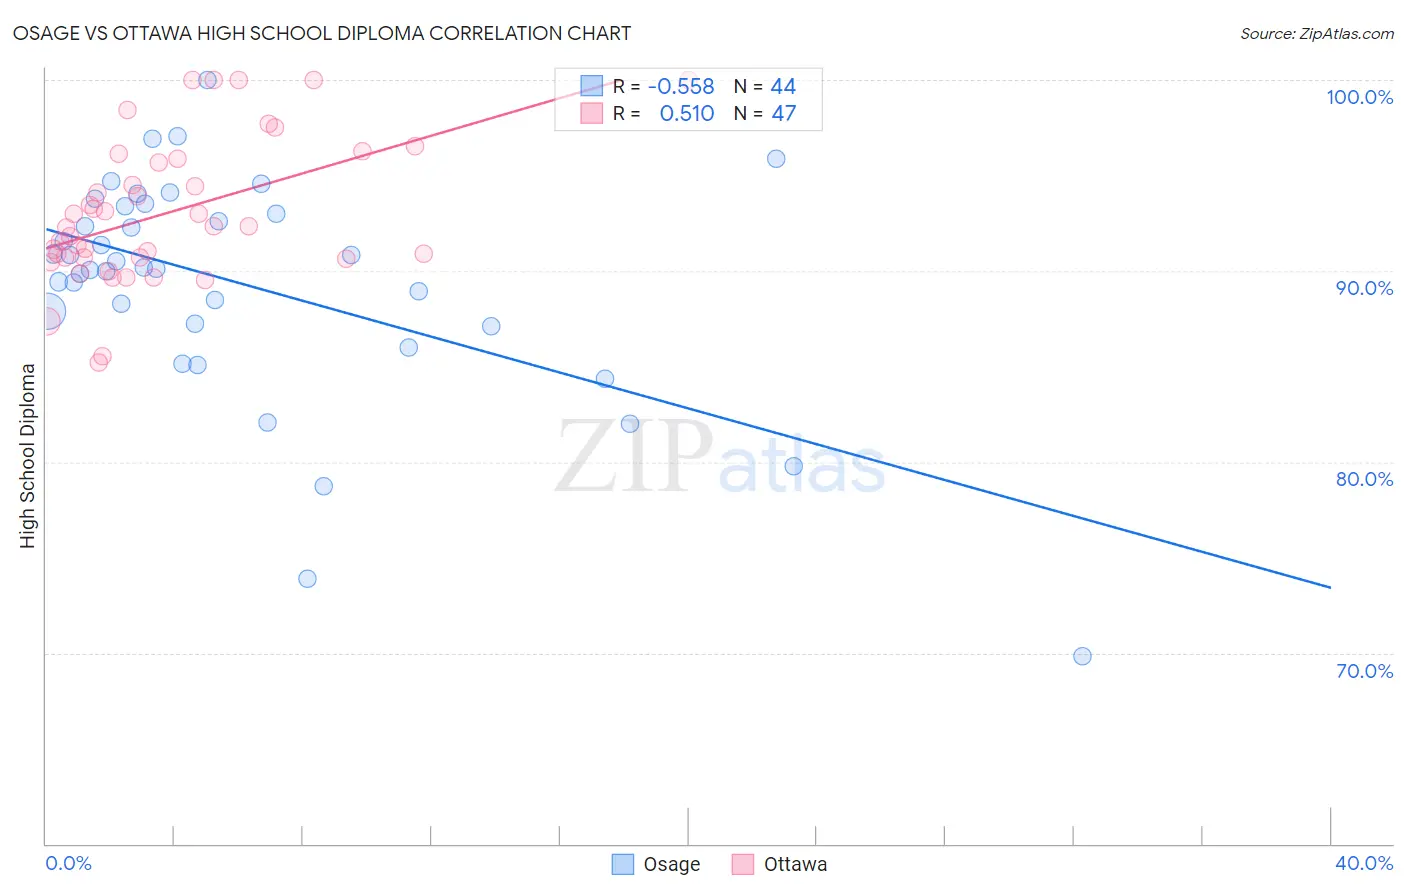
Osage vs Ottawa High School Diploma Correlation Chart
The statistical analysis conducted on geographies consisting of 91,808,913 people shows a substantial negative correlation between the proportion of Osage and percentage of population with at least high school diploma education in the United States with a correlation coefficient (R) of -0.558 and weighted average of 89.1%. Similarly, the statistical analysis conducted on geographies consisting of 49,956,602 people shows a substantial positive correlation between the proportion of Ottawa and percentage of population with at least high school diploma education in the United States with a correlation coefficient (R) of 0.510 and weighted average of 90.1%, a difference of 1.1%.
High School Diploma Correlation Summary
| Measurement | Osage | Ottawa |
| Minimum | 69.8% | 85.2% |
| Maximum | 100.0% | 100.0% |
| Range | 30.2% | 14.8% |
| Mean | 89.3% | 93.1% |
| Median | 90.1% | 92.4% |
| Interquartile 25% (IQ1) | 87.2% | 90.7% |
| Interquartile 75% (IQ3) | 93.2% | 95.9% |
| Interquartile Range (IQR) | 6.0% | 5.2% |
| Standard Deviation (Sample) | 5.9% | 3.7% |
| Standard Deviation (Population) | 5.8% | 3.7% |
Similar Demographics by High School Diploma
Demographics Similar to Osage by High School Diploma
In terms of high school diploma, the demographic groups most similar to Osage are Immigrants from Western Asia (89.1%, a difference of 0.0%), Sudanese (89.1%, a difference of 0.010%), Sierra Leonean (89.1%, a difference of 0.010%), Immigrants from Indonesia (89.1%, a difference of 0.020%), and Hmong (89.1%, a difference of 0.020%).
| Demographics | Rating | Rank | High School Diploma |
| Iroquois | 55.1 /100 | #169 | Average 89.2% |
| Immigrants | Morocco | 53.3 /100 | #170 | Average 89.2% |
| Spanish | 52.9 /100 | #171 | Average 89.2% |
| Immigrants | Nonimmigrants | 51.8 /100 | #172 | Average 89.2% |
| Immigrants | Indonesia | 50.3 /100 | #173 | Average 89.1% |
| Hmong | 50.0 /100 | #174 | Average 89.1% |
| Immigrants | Western Asia | 49.0 /100 | #175 | Average 89.1% |
| Osage | 48.9 /100 | #176 | Average 89.1% |
| Sudanese | 48.5 /100 | #177 | Average 89.1% |
| Sierra Leoneans | 48.4 /100 | #178 | Average 89.1% |
| Americans | 47.2 /100 | #179 | Average 89.1% |
| Bolivians | 45.2 /100 | #180 | Average 89.1% |
| Venezuelans | 43.6 /100 | #181 | Average 89.1% |
| Spaniards | 43.4 /100 | #182 | Average 89.1% |
| Potawatomi | 42.5 /100 | #183 | Average 89.0% |
Demographics Similar to Ottawa by High School Diploma
In terms of high school diploma, the demographic groups most similar to Ottawa are White/Caucasian (90.1%, a difference of 0.020%), Immigrants from Eastern Europe (90.1%, a difference of 0.030%), Israeli (90.1%, a difference of 0.050%), Jordanian (90.2%, a difference of 0.070%), and Immigrants from Kazakhstan (90.0%, a difference of 0.070%).
| Demographics | Rating | Rank | High School Diploma |
| Immigrants | Sri Lanka | 96.3 /100 | #113 | Exceptional 90.2% |
| Yugoslavians | 96.2 /100 | #114 | Exceptional 90.2% |
| Immigrants | Hungary | 95.8 /100 | #115 | Exceptional 90.2% |
| Immigrants | Germany | 95.7 /100 | #116 | Exceptional 90.2% |
| Jordanians | 95.4 /100 | #117 | Exceptional 90.2% |
| Israelis | 95.1 /100 | #118 | Exceptional 90.1% |
| Immigrants | Eastern Europe | 94.9 /100 | #119 | Exceptional 90.1% |
| Ottawa | 94.4 /100 | #120 | Exceptional 90.1% |
| Whites/Caucasians | 94.1 /100 | #121 | Exceptional 90.1% |
| Immigrants | Kazakhstan | 93.4 /100 | #122 | Exceptional 90.0% |
| German Russians | 92.0 /100 | #123 | Exceptional 90.0% |
| Mongolians | 91.6 /100 | #124 | Exceptional 89.9% |
| Egyptians | 91.1 /100 | #125 | Exceptional 89.9% |
| Alaska Natives | 91.0 /100 | #126 | Exceptional 89.9% |
| Immigrants | Eastern Asia | 89.2 /100 | #127 | Excellent 89.9% |