Northern European vs Potawatomi 6th Grade
COMPARE
Northern European
Potawatomi
6th Grade
6th Grade Comparison
Northern Europeans
Potawatomi
97.8%
6TH GRADE
99.9/ 100
METRIC RATING
43rd/ 347
METRIC RANK
97.6%
6TH GRADE
99.1/ 100
METRIC RATING
83rd/ 347
METRIC RANK
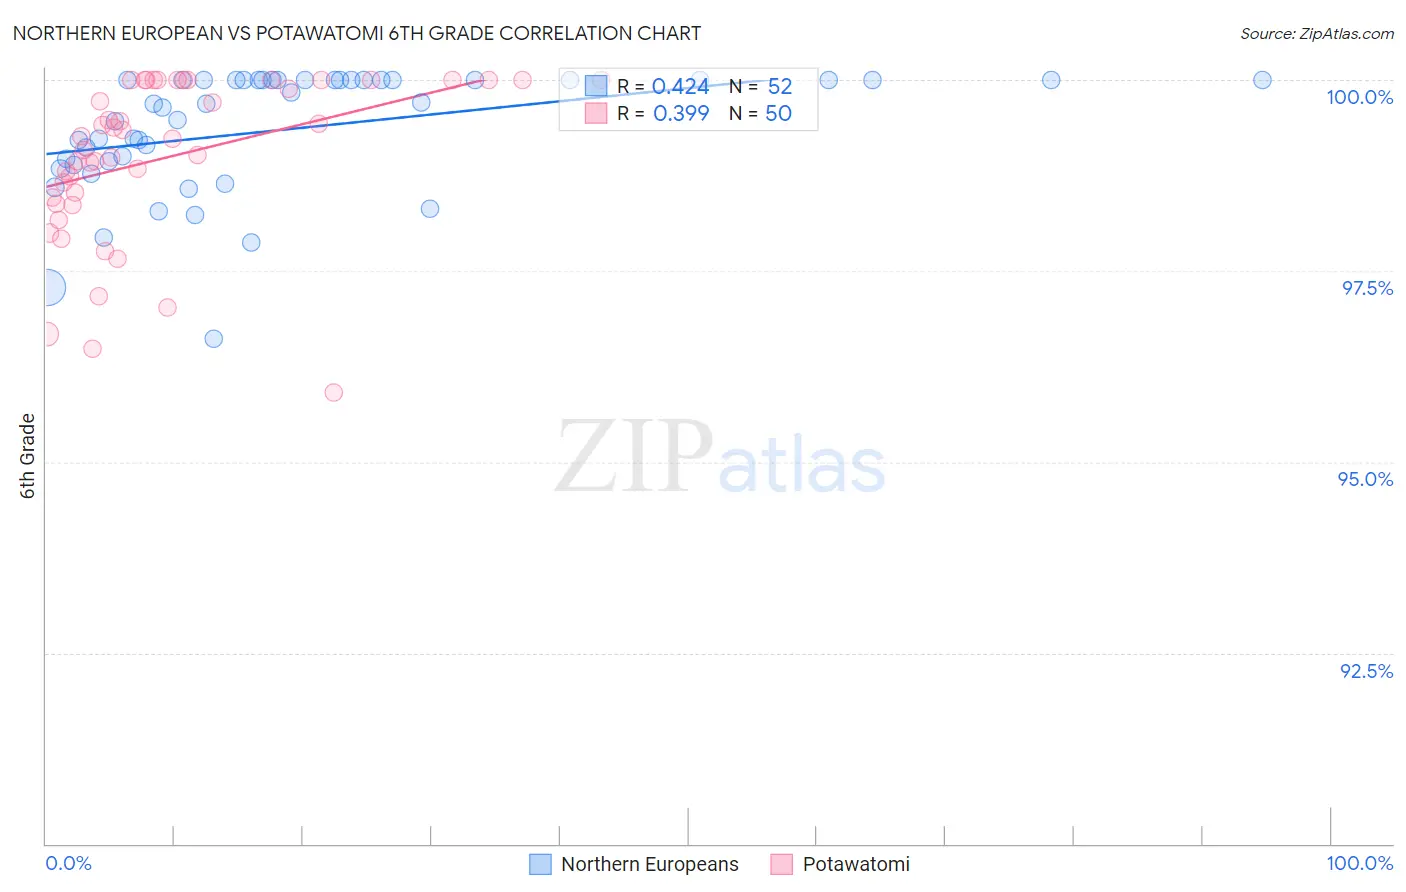
Northern European vs Potawatomi 6th Grade Correlation Chart
The statistical analysis conducted on geographies consisting of 406,093,361 people shows a moderate positive correlation between the proportion of Northern Europeans and percentage of population with at least 6th grade education in the United States with a correlation coefficient (R) of 0.424 and weighted average of 97.8%. Similarly, the statistical analysis conducted on geographies consisting of 117,769,196 people shows a mild positive correlation between the proportion of Potawatomi and percentage of population with at least 6th grade education in the United States with a correlation coefficient (R) of 0.399 and weighted average of 97.6%, a difference of 0.27%.
6th Grade Correlation Summary
| Measurement | Northern European | Potawatomi |
| Minimum | 96.6% | 95.9% |
| Maximum | 100.0% | 100.0% |
| Range | 3.4% | 4.1% |
| Mean | 99.4% | 99.0% |
| Median | 99.7% | 99.3% |
| Interquartile 25% (IQ1) | 98.9% | 98.5% |
| Interquartile 75% (IQ3) | 100.0% | 100.0% |
| Interquartile Range (IQR) | 1.1% | 1.5% |
| Standard Deviation (Sample) | 0.80% | 1.1% |
| Standard Deviation (Population) | 0.80% | 1.0% |
Similar Demographics by 6th Grade
Demographics Similar to Northern Europeans by 6th Grade
In terms of 6th grade, the demographic groups most similar to Northern Europeans are Hungarian (97.8%, a difference of 0.010%), Eastern European (97.9%, a difference of 0.020%), Czechoslovakian (97.8%, a difference of 0.030%), Latvian (97.9%, a difference of 0.050%), and Bulgarian (97.8%, a difference of 0.050%).
| Demographics | Rating | Rank | 6th Grade |
| Italians | 100.0 /100 | #36 | Exceptional 97.9% |
| British | 100.0 /100 | #37 | Exceptional 97.9% |
| Belgians | 100.0 /100 | #38 | Exceptional 97.9% |
| Luxembourgers | 99.9 /100 | #39 | Exceptional 97.9% |
| Latvians | 99.9 /100 | #40 | Exceptional 97.9% |
| Eastern Europeans | 99.9 /100 | #41 | Exceptional 97.9% |
| Hungarians | 99.9 /100 | #42 | Exceptional 97.8% |
| Northern Europeans | 99.9 /100 | #43 | Exceptional 97.8% |
| Czechoslovakians | 99.9 /100 | #44 | Exceptional 97.8% |
| Bulgarians | 99.9 /100 | #45 | Exceptional 97.8% |
| Arapaho | 99.9 /100 | #46 | Exceptional 97.8% |
| Native Hawaiians | 99.9 /100 | #47 | Exceptional 97.8% |
| Celtics | 99.9 /100 | #48 | Exceptional 97.8% |
| Estonians | 99.8 /100 | #49 | Exceptional 97.8% |
| Immigrants | Scotland | 99.8 /100 | #50 | Exceptional 97.8% |
Demographics Similar to Potawatomi by 6th Grade
In terms of 6th grade, the demographic groups most similar to Potawatomi are Lumbee (97.6%, a difference of 0.010%), Zimbabwean (97.6%, a difference of 0.010%), Shoshone (97.6%, a difference of 0.010%), Immigrants from India (97.6%, a difference of 0.020%), and Osage (97.6%, a difference of 0.020%).
| Demographics | Rating | Rank | 6th Grade |
| Immigrants | England | 99.4 /100 | #76 | Exceptional 97.6% |
| Immigrants | Lithuania | 99.3 /100 | #77 | Exceptional 97.6% |
| Icelanders | 99.3 /100 | #78 | Exceptional 97.6% |
| Immigrants | India | 99.3 /100 | #79 | Exceptional 97.6% |
| Osage | 99.3 /100 | #80 | Exceptional 97.6% |
| Lumbee | 99.2 /100 | #81 | Exceptional 97.6% |
| Zimbabweans | 99.1 /100 | #82 | Exceptional 97.6% |
| Potawatomi | 99.1 /100 | #83 | Exceptional 97.6% |
| Shoshone | 99.0 /100 | #84 | Exceptional 97.6% |
| Delaware | 98.9 /100 | #85 | Exceptional 97.6% |
| Immigrants | Belgium | 98.9 /100 | #86 | Exceptional 97.5% |
| Puget Sound Salish | 98.9 /100 | #87 | Exceptional 97.5% |
| Immigrants | South Africa | 98.9 /100 | #88 | Exceptional 97.5% |
| Immigrants | Australia | 98.8 /100 | #89 | Exceptional 97.5% |
| Pueblo | 98.8 /100 | #90 | Exceptional 97.5% |