Nonimmigrants vs Immigrants from Ghana High School Diploma
COMPARE
Nonimmigrants
Immigrants from Ghana
High School Diploma
High School Diploma Comparison
Nonimmigrants
Immigrants from Ghana
89.2%
HIGH SCHOOL DIPLOMA
51.8/ 100
METRIC RATING
172nd/ 347
METRIC RANK
87.4%
HIGH SCHOOL DIPLOMA
0.5/ 100
METRIC RATING
258th/ 347
METRIC RANK
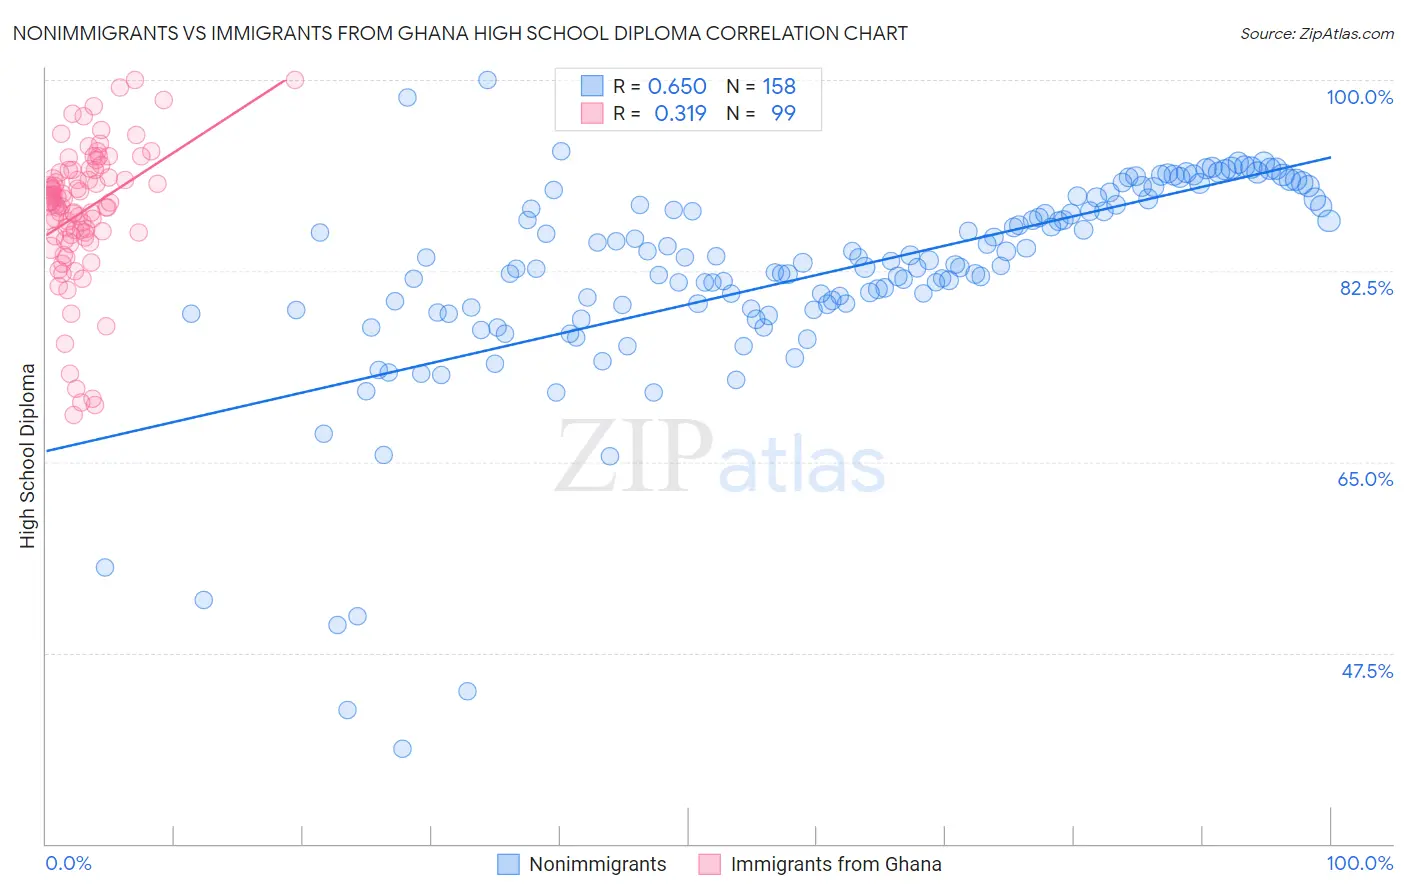
Nonimmigrants vs Immigrants from Ghana High School Diploma Correlation Chart
The statistical analysis conducted on geographies consisting of 585,368,950 people shows a significant positive correlation between the proportion of Nonimmigrants and percentage of population with at least high school diploma education in the United States with a correlation coefficient (R) of 0.650 and weighted average of 89.2%. Similarly, the statistical analysis conducted on geographies consisting of 199,951,982 people shows a mild positive correlation between the proportion of Immigrants from Ghana and percentage of population with at least high school diploma education in the United States with a correlation coefficient (R) of 0.319 and weighted average of 87.4%, a difference of 2.1%.
High School Diploma Correlation Summary
| Measurement | Nonimmigrants | Immigrants from Ghana |
| Minimum | 38.7% | 69.3% |
| Maximum | 100.0% | 100.0% |
| Range | 61.3% | 30.7% |
| Mean | 82.2% | 87.9% |
| Median | 83.2% | 88.9% |
| Interquartile 25% (IQ1) | 79.0% | 85.7% |
| Interquartile 75% (IQ3) | 88.6% | 91.8% |
| Interquartile Range (IQR) | 9.6% | 6.1% |
| Standard Deviation (Sample) | 9.8% | 6.3% |
| Standard Deviation (Population) | 9.7% | 6.3% |
Similar Demographics by High School Diploma
Demographics Similar to Nonimmigrants by High School Diploma
In terms of high school diploma, the demographic groups most similar to Nonimmigrants are Immigrants from Morocco (89.2%, a difference of 0.020%), Spanish (89.2%, a difference of 0.020%), Immigrants from Indonesia (89.1%, a difference of 0.020%), Hmong (89.1%, a difference of 0.030%), and Immigrants from Western Asia (89.1%, a difference of 0.040%).
| Demographics | Rating | Rank | High School Diploma |
| Immigrants | Asia | 59.8 /100 | #165 | Average 89.3% |
| Immigrants | Albania | 59.4 /100 | #166 | Average 89.3% |
| Immigrants | Hong Kong | 58.6 /100 | #167 | Average 89.3% |
| Delaware | 55.8 /100 | #168 | Average 89.2% |
| Iroquois | 55.1 /100 | #169 | Average 89.2% |
| Immigrants | Morocco | 53.3 /100 | #170 | Average 89.2% |
| Spanish | 52.9 /100 | #171 | Average 89.2% |
| Immigrants | Nonimmigrants | 51.8 /100 | #172 | Average 89.2% |
| Immigrants | Indonesia | 50.3 /100 | #173 | Average 89.1% |
| Hmong | 50.0 /100 | #174 | Average 89.1% |
| Immigrants | Western Asia | 49.0 /100 | #175 | Average 89.1% |
| Osage | 48.9 /100 | #176 | Average 89.1% |
| Sudanese | 48.5 /100 | #177 | Average 89.1% |
| Sierra Leoneans | 48.4 /100 | #178 | Average 89.1% |
| Americans | 47.2 /100 | #179 | Average 89.1% |
Demographics Similar to Immigrants from Ghana by High School Diploma
In terms of high school diploma, the demographic groups most similar to Immigrants from Ghana are Immigrants from Western Africa (87.4%, a difference of 0.010%), Cajun (87.3%, a difference of 0.080%), Bahamian (87.5%, a difference of 0.10%), Seminole (87.3%, a difference of 0.10%), and African (87.5%, a difference of 0.11%).
| Demographics | Rating | Rank | High School Diploma |
| Ghanaians | 1.4 /100 | #251 | Tragic 87.7% |
| Immigrants | South America | 1.2 /100 | #252 | Tragic 87.6% |
| Immigrants | Uruguay | 1.0 /100 | #253 | Tragic 87.6% |
| Immigrants | Colombia | 1.0 /100 | #254 | Tragic 87.6% |
| Immigrants | Senegal | 0.9 /100 | #255 | Tragic 87.6% |
| Africans | 0.7 /100 | #256 | Tragic 87.5% |
| Bahamians | 0.7 /100 | #257 | Tragic 87.5% |
| Immigrants | Ghana | 0.5 /100 | #258 | Tragic 87.4% |
| Immigrants | Western Africa | 0.5 /100 | #259 | Tragic 87.4% |
| Cajuns | 0.4 /100 | #260 | Tragic 87.3% |
| Seminole | 0.4 /100 | #261 | Tragic 87.3% |
| Immigrants | Peru | 0.4 /100 | #262 | Tragic 87.3% |
| Immigrants | South Eastern Asia | 0.3 /100 | #263 | Tragic 87.2% |
| Jamaicans | 0.3 /100 | #264 | Tragic 87.2% |
| U.S. Virgin Islanders | 0.2 /100 | #265 | Tragic 87.1% |