Nicaraguan vs Immigrants from Guatemala 9th Grade
COMPARE
Nicaraguan
Immigrants from Guatemala
9th Grade
9th Grade Comparison
Nicaraguans
Immigrants from Guatemala
91.9%
9TH GRADE
0.0/ 100
METRIC RATING
320th/ 347
METRIC RANK
89.4%
9TH GRADE
0.0/ 100
METRIC RATING
343rd/ 347
METRIC RANK
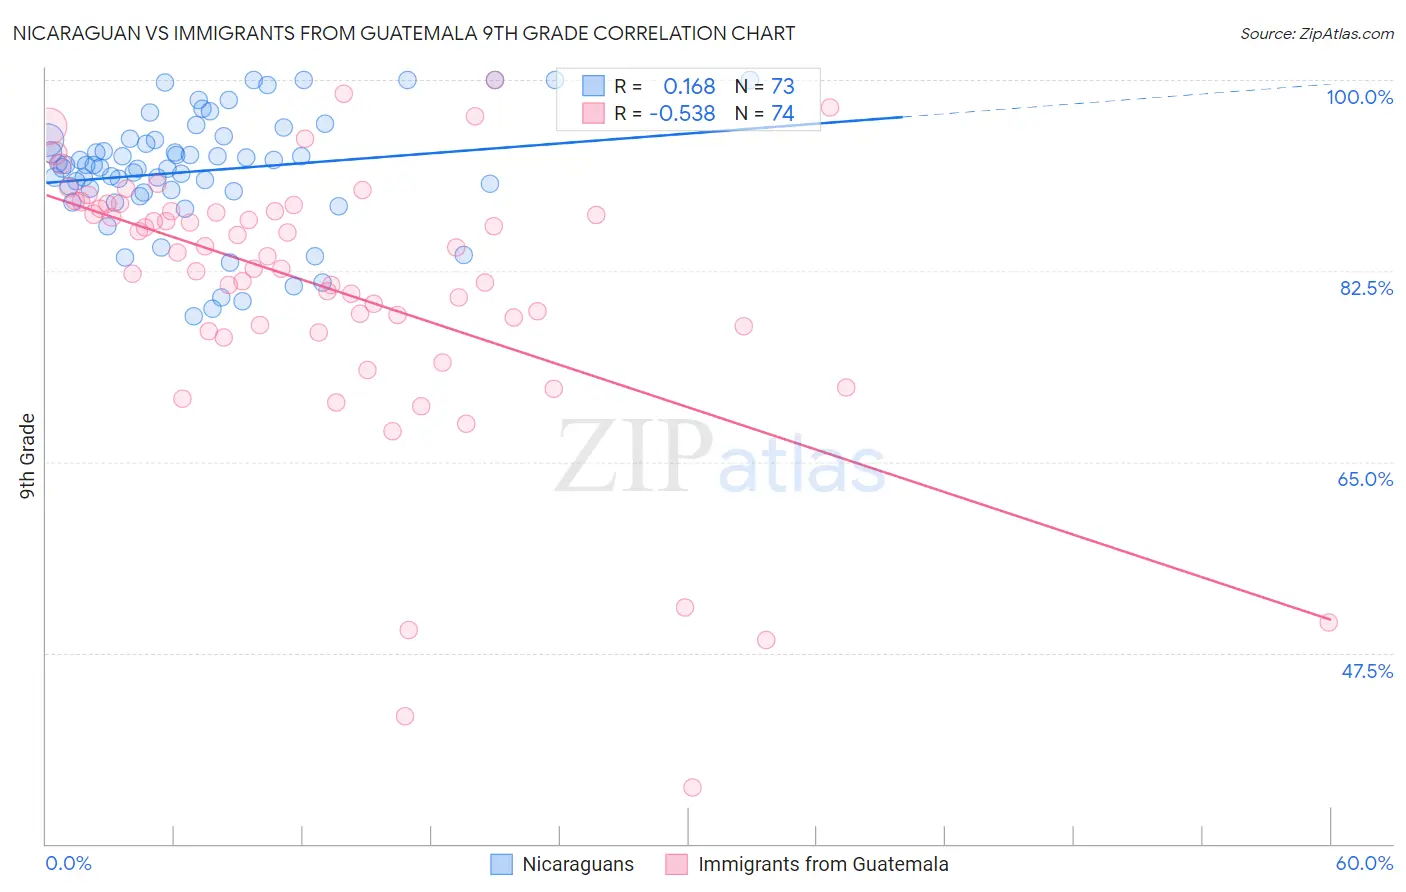
Nicaraguan vs Immigrants from Guatemala 9th Grade Correlation Chart
The statistical analysis conducted on geographies consisting of 285,711,651 people shows a poor positive correlation between the proportion of Nicaraguans and percentage of population with at least 9th grade education in the United States with a correlation coefficient (R) of 0.168 and weighted average of 91.9%. Similarly, the statistical analysis conducted on geographies consisting of 377,286,142 people shows a substantial negative correlation between the proportion of Immigrants from Guatemala and percentage of population with at least 9th grade education in the United States with a correlation coefficient (R) of -0.538 and weighted average of 89.4%, a difference of 2.8%.
9th Grade Correlation Summary
| Measurement | Nicaraguan | Immigrants from Guatemala |
| Minimum | 78.3% | 35.2% |
| Maximum | 100.0% | 100.0% |
| Range | 21.7% | 64.8% |
| Mean | 91.7% | 80.9% |
| Median | 92.2% | 84.1% |
| Interquartile 25% (IQ1) | 89.8% | 77.5% |
| Interquartile 75% (IQ3) | 94.6% | 88.2% |
| Interquartile Range (IQR) | 4.8% | 10.7% |
| Standard Deviation (Sample) | 5.4% | 12.7% |
| Standard Deviation (Population) | 5.3% | 12.6% |
Similar Demographics by 9th Grade
Demographics Similar to Nicaraguans by 9th Grade
In terms of 9th grade, the demographic groups most similar to Nicaraguans are Ecuadorian (91.9%, a difference of 0.040%), Immigrants from Ecuador (91.8%, a difference of 0.070%), Nepalese (92.0%, a difference of 0.090%), Belizean (91.8%, a difference of 0.090%), and Puerto Rican (91.8%, a difference of 0.090%).
| Demographics | Rating | Rank | 9th Grade |
| Vietnamese | 0.0 /100 | #313 | Tragic 92.3% |
| Immigrants | Portugal | 0.0 /100 | #314 | Tragic 92.2% |
| Immigrants | Caribbean | 0.0 /100 | #315 | Tragic 92.2% |
| Cape Verdeans | 0.0 /100 | #316 | Tragic 92.2% |
| Immigrants | Cuba | 0.0 /100 | #317 | Tragic 92.2% |
| Nepalese | 0.0 /100 | #318 | Tragic 92.0% |
| Ecuadorians | 0.0 /100 | #319 | Tragic 91.9% |
| Nicaraguans | 0.0 /100 | #320 | Tragic 91.9% |
| Immigrants | Ecuador | 0.0 /100 | #321 | Tragic 91.8% |
| Belizeans | 0.0 /100 | #322 | Tragic 91.8% |
| Puerto Ricans | 0.0 /100 | #323 | Tragic 91.8% |
| Immigrants | Belize | 0.0 /100 | #324 | Tragic 91.8% |
| Central American Indians | 0.0 /100 | #325 | Tragic 91.5% |
| Immigrants | Armenia | 0.0 /100 | #326 | Tragic 91.4% |
| Immigrants | Nicaragua | 0.0 /100 | #327 | Tragic 91.3% |
Demographics Similar to Immigrants from Guatemala by 9th Grade
In terms of 9th grade, the demographic groups most similar to Immigrants from Guatemala are Salvadoran (89.6%, a difference of 0.20%), Guatemalan (89.9%, a difference of 0.51%), Immigrants from El Salvador (89.0%, a difference of 0.51%), Immigrants from Central America (89.0%, a difference of 0.53%), and Mexican (90.0%, a difference of 0.63%).
| Demographics | Rating | Rank | 9th Grade |
| Immigrants | Yemen | 0.0 /100 | #333 | Tragic 90.8% |
| Immigrants | Azores | 0.0 /100 | #334 | Tragic 90.8% |
| Immigrants | Honduras | 0.0 /100 | #335 | Tragic 90.6% |
| Immigrants | Dominican Republic | 0.0 /100 | #336 | Tragic 90.5% |
| Immigrants | Latin America | 0.0 /100 | #337 | Tragic 90.4% |
| Central Americans | 0.0 /100 | #338 | Tragic 90.4% |
| Yakama | 0.0 /100 | #339 | Tragic 90.1% |
| Mexicans | 0.0 /100 | #340 | Tragic 90.0% |
| Guatemalans | 0.0 /100 | #341 | Tragic 89.9% |
| Salvadorans | 0.0 /100 | #342 | Tragic 89.6% |
| Immigrants | Guatemala | 0.0 /100 | #343 | Tragic 89.4% |
| Immigrants | El Salvador | 0.0 /100 | #344 | Tragic 89.0% |
| Immigrants | Central America | 0.0 /100 | #345 | Tragic 89.0% |
| Immigrants | Mexico | 0.0 /100 | #346 | Tragic 88.7% |
| Spanish American Indians | 0.0 /100 | #347 | Tragic 88.3% |