Nicaraguan vs Immigrants from Costa Rica Doctorate Degree
COMPARE
Nicaraguan
Immigrants from Costa Rica
Doctorate Degree
Doctorate Degree Comparison
Nicaraguans
Immigrants from Costa Rica
1.5%
DOCTORATE DEGREE
0.6/ 100
METRIC RATING
265th/ 347
METRIC RANK
1.8%
DOCTORATE DEGREE
30.2/ 100
METRIC RATING
190th/ 347
METRIC RANK
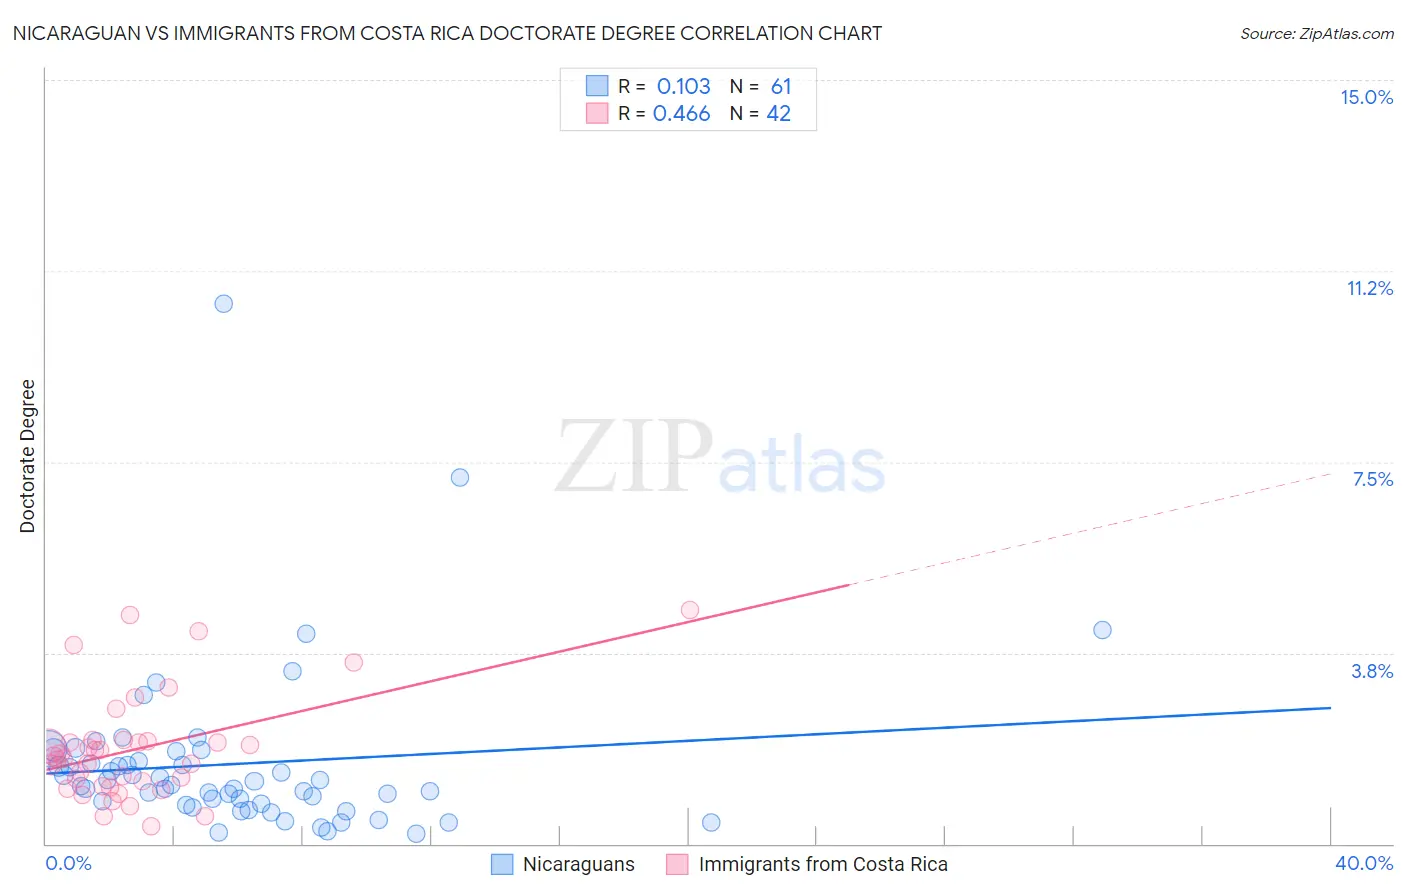
Nicaraguan vs Immigrants from Costa Rica Doctorate Degree Correlation Chart
The statistical analysis conducted on geographies consisting of 283,726,433 people shows a poor positive correlation between the proportion of Nicaraguans and percentage of population with at least doctorate degree education in the United States with a correlation coefficient (R) of 0.103 and weighted average of 1.5%. Similarly, the statistical analysis conducted on geographies consisting of 203,508,401 people shows a moderate positive correlation between the proportion of Immigrants from Costa Rica and percentage of population with at least doctorate degree education in the United States with a correlation coefficient (R) of 0.466 and weighted average of 1.8%, a difference of 18.8%.
Doctorate Degree Correlation Summary
| Measurement | Nicaraguan | Immigrants from Costa Rica |
| Minimum | 0.20% | 0.34% |
| Maximum | 10.6% | 4.6% |
| Range | 10.4% | 4.2% |
| Mean | 1.6% | 1.9% |
| Median | 1.2% | 1.7% |
| Interquartile 25% (IQ1) | 0.78% | 1.1% |
| Interquartile 75% (IQ3) | 1.7% | 2.0% |
| Interquartile Range (IQR) | 0.94% | 0.89% |
| Standard Deviation (Sample) | 1.6% | 1.0% |
| Standard Deviation (Population) | 1.6% | 1.0% |
Similar Demographics by Doctorate Degree
Demographics Similar to Nicaraguans by Doctorate Degree
In terms of doctorate degree, the demographic groups most similar to Nicaraguans are Blackfeet (1.5%, a difference of 0.28%), Immigrants from Bahamas (1.5%, a difference of 0.47%), Chickasaw (1.5%, a difference of 0.64%), Immigrants from Liberia (1.5%, a difference of 0.78%), and Immigrants from Portugal (1.5%, a difference of 0.79%).
| Demographics | Rating | Rank | Doctorate Degree |
| Immigrants | West Indies | 0.9 /100 | #258 | Tragic 1.5% |
| Liberians | 0.9 /100 | #259 | Tragic 1.5% |
| Japanese | 0.9 /100 | #260 | Tragic 1.5% |
| Immigrants | Portugal | 0.8 /100 | #261 | Tragic 1.5% |
| Chickasaw | 0.7 /100 | #262 | Tragic 1.5% |
| Immigrants | Bahamas | 0.7 /100 | #263 | Tragic 1.5% |
| Blackfeet | 0.7 /100 | #264 | Tragic 1.5% |
| Nicaraguans | 0.6 /100 | #265 | Tragic 1.5% |
| Immigrants | Liberia | 0.5 /100 | #266 | Tragic 1.5% |
| Kiowa | 0.5 /100 | #267 | Tragic 1.5% |
| U.S. Virgin Islanders | 0.5 /100 | #268 | Tragic 1.5% |
| Crow | 0.5 /100 | #269 | Tragic 1.5% |
| Salvadorans | 0.5 /100 | #270 | Tragic 1.5% |
| Immigrants | Trinidad and Tobago | 0.5 /100 | #271 | Tragic 1.5% |
| Immigrants | Barbados | 0.4 /100 | #272 | Tragic 1.5% |
Demographics Similar to Immigrants from Costa Rica by Doctorate Degree
In terms of doctorate degree, the demographic groups most similar to Immigrants from Costa Rica are French Canadian (1.8%, a difference of 0.020%), German (1.8%, a difference of 0.060%), South American (1.8%, a difference of 0.12%), Czechoslovakian (1.8%, a difference of 0.50%), and Dutch (1.8%, a difference of 0.51%).
| Demographics | Rating | Rank | Doctorate Degree |
| Finns | 42.1 /100 | #183 | Average 1.8% |
| Nigerians | 39.9 /100 | #184 | Fair 1.8% |
| Slovaks | 36.4 /100 | #185 | Fair 1.8% |
| Peruvians | 34.4 /100 | #186 | Fair 1.8% |
| Czechoslovakians | 33.0 /100 | #187 | Fair 1.8% |
| Germans | 30.5 /100 | #188 | Fair 1.8% |
| French Canadians | 30.2 /100 | #189 | Fair 1.8% |
| Immigrants | Costa Rica | 30.2 /100 | #190 | Fair 1.8% |
| South Americans | 29.5 /100 | #191 | Fair 1.8% |
| Dutch | 27.4 /100 | #192 | Fair 1.8% |
| German Russians | 27.1 /100 | #193 | Fair 1.8% |
| Uruguayans | 26.2 /100 | #194 | Fair 1.8% |
| Immigrants | Somalia | 25.4 /100 | #195 | Fair 1.8% |
| Sub-Saharan Africans | 25.1 /100 | #196 | Fair 1.8% |
| Chinese | 25.1 /100 | #197 | Fair 1.8% |