Nicaraguan vs Immigrants from Brazil 6th Grade
COMPARE
Nicaraguan
Immigrants from Brazil
6th Grade
6th Grade Comparison
Nicaraguans
Immigrants from Brazil
95.4%
6TH GRADE
0.0/ 100
METRIC RATING
313th/ 347
METRIC RANK
96.9%
6TH GRADE
25.5/ 100
METRIC RATING
195th/ 347
METRIC RANK
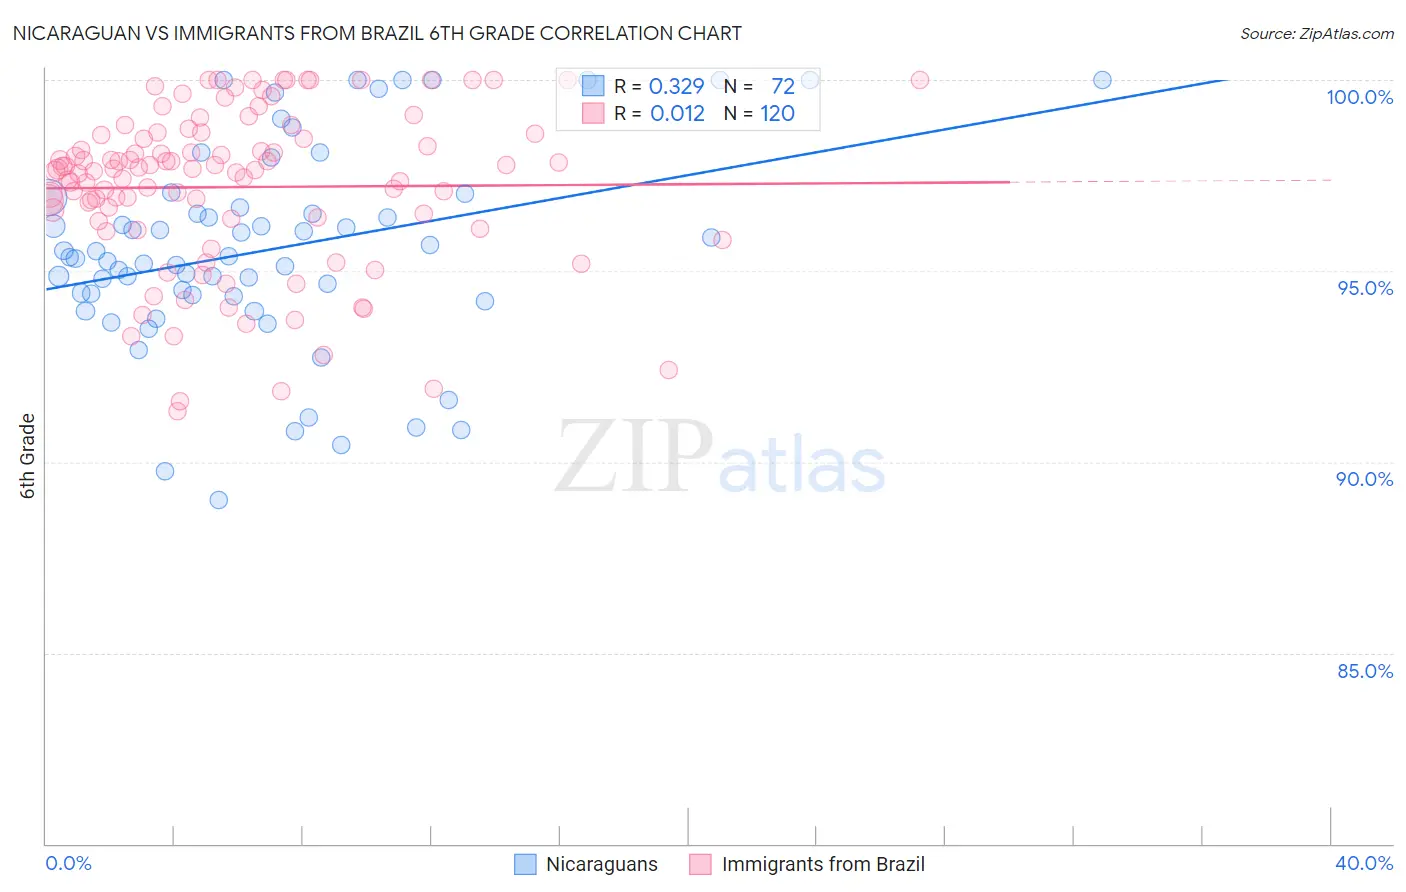
Nicaraguan vs Immigrants from Brazil 6th Grade Correlation Chart
The statistical analysis conducted on geographies consisting of 285,711,389 people shows a mild positive correlation between the proportion of Nicaraguans and percentage of population with at least 6th grade education in the United States with a correlation coefficient (R) of 0.329 and weighted average of 95.4%. Similarly, the statistical analysis conducted on geographies consisting of 343,021,580 people shows no correlation between the proportion of Immigrants from Brazil and percentage of population with at least 6th grade education in the United States with a correlation coefficient (R) of 0.012 and weighted average of 96.9%, a difference of 1.6%.
6th Grade Correlation Summary
| Measurement | Nicaraguan | Immigrants from Brazil |
| Minimum | 89.0% | 91.3% |
| Maximum | 100.0% | 100.0% |
| Range | 11.0% | 8.7% |
| Mean | 95.6% | 97.2% |
| Median | 95.4% | 97.6% |
| Interquartile 25% (IQ1) | 94.4% | 96.3% |
| Interquartile 75% (IQ3) | 96.8% | 98.6% |
| Interquartile Range (IQR) | 2.4% | 2.2% |
| Standard Deviation (Sample) | 2.7% | 2.1% |
| Standard Deviation (Population) | 2.6% | 2.1% |
Similar Demographics by 6th Grade
Demographics Similar to Nicaraguans by 6th Grade
In terms of 6th grade, the demographic groups most similar to Nicaraguans are Immigrants from Vietnam (95.4%, a difference of 0.010%), Immigrants from Bangladesh (95.4%, a difference of 0.020%), Japanese (95.4%, a difference of 0.030%), Vietnamese (95.3%, a difference of 0.060%), and Belizean (95.3%, a difference of 0.080%).
| Demographics | Rating | Rank | 6th Grade |
| Immigrants | Haiti | 0.0 /100 | #306 | Tragic 95.6% |
| Guyanese | 0.0 /100 | #307 | Tragic 95.6% |
| Immigrants | Caribbean | 0.0 /100 | #308 | Tragic 95.6% |
| Puerto Ricans | 0.0 /100 | #309 | Tragic 95.5% |
| Ecuadorians | 0.0 /100 | #310 | Tragic 95.5% |
| Immigrants | Portugal | 0.0 /100 | #311 | Tragic 95.5% |
| Immigrants | Guyana | 0.0 /100 | #312 | Tragic 95.5% |
| Nicaraguans | 0.0 /100 | #313 | Tragic 95.4% |
| Immigrants | Vietnam | 0.0 /100 | #314 | Tragic 95.4% |
| Immigrants | Bangladesh | 0.0 /100 | #315 | Tragic 95.4% |
| Japanese | 0.0 /100 | #316 | Tragic 95.4% |
| Vietnamese | 0.0 /100 | #317 | Tragic 95.3% |
| Belizeans | 0.0 /100 | #318 | Tragic 95.3% |
| Immigrants | Belize | 0.0 /100 | #319 | Tragic 95.3% |
| Immigrants | Ecuador | 0.0 /100 | #320 | Tragic 95.3% |
Demographics Similar to Immigrants from Brazil by 6th Grade
In terms of 6th grade, the demographic groups most similar to Immigrants from Brazil are Immigrants from Lebanon (96.9%, a difference of 0.0%), Panamanian (96.9%, a difference of 0.010%), Hawaiian (96.9%, a difference of 0.010%), Paraguayan (96.9%, a difference of 0.010%), and Dutch West Indian (96.9%, a difference of 0.020%).
| Demographics | Rating | Rank | 6th Grade |
| Immigrants | Argentina | 30.4 /100 | #188 | Fair 97.0% |
| Blacks/African Americans | 30.2 /100 | #189 | Fair 97.0% |
| Dutch West Indians | 28.3 /100 | #190 | Fair 96.9% |
| Panamanians | 27.3 /100 | #191 | Fair 96.9% |
| Hawaiians | 27.0 /100 | #192 | Fair 96.9% |
| Paraguayans | 26.6 /100 | #193 | Fair 96.9% |
| Immigrants | Lebanon | 25.6 /100 | #194 | Fair 96.9% |
| Immigrants | Brazil | 25.5 /100 | #195 | Fair 96.9% |
| Immigrants | Uganda | 21.2 /100 | #196 | Fair 96.9% |
| Brazilians | 20.1 /100 | #197 | Fair 96.9% |
| Immigrants | Albania | 18.8 /100 | #198 | Poor 96.9% |
| Immigrants | Northern Africa | 15.7 /100 | #199 | Poor 96.9% |
| Africans | 14.8 /100 | #200 | Poor 96.9% |
| Immigrants | Zaire | 14.5 /100 | #201 | Poor 96.9% |
| Immigrants | Chile | 14.2 /100 | #202 | Poor 96.8% |