New Zealander vs Inupiat 5th Grade
COMPARE
New Zealander
Inupiat
5th Grade
5th Grade Comparison
New Zealanders
Inupiat
97.9%
5TH GRADE
99.6/ 100
METRIC RATING
67th/ 347
METRIC RANK
98.4%
5TH GRADE
100.0/ 100
METRIC RATING
7th/ 347
METRIC RANK
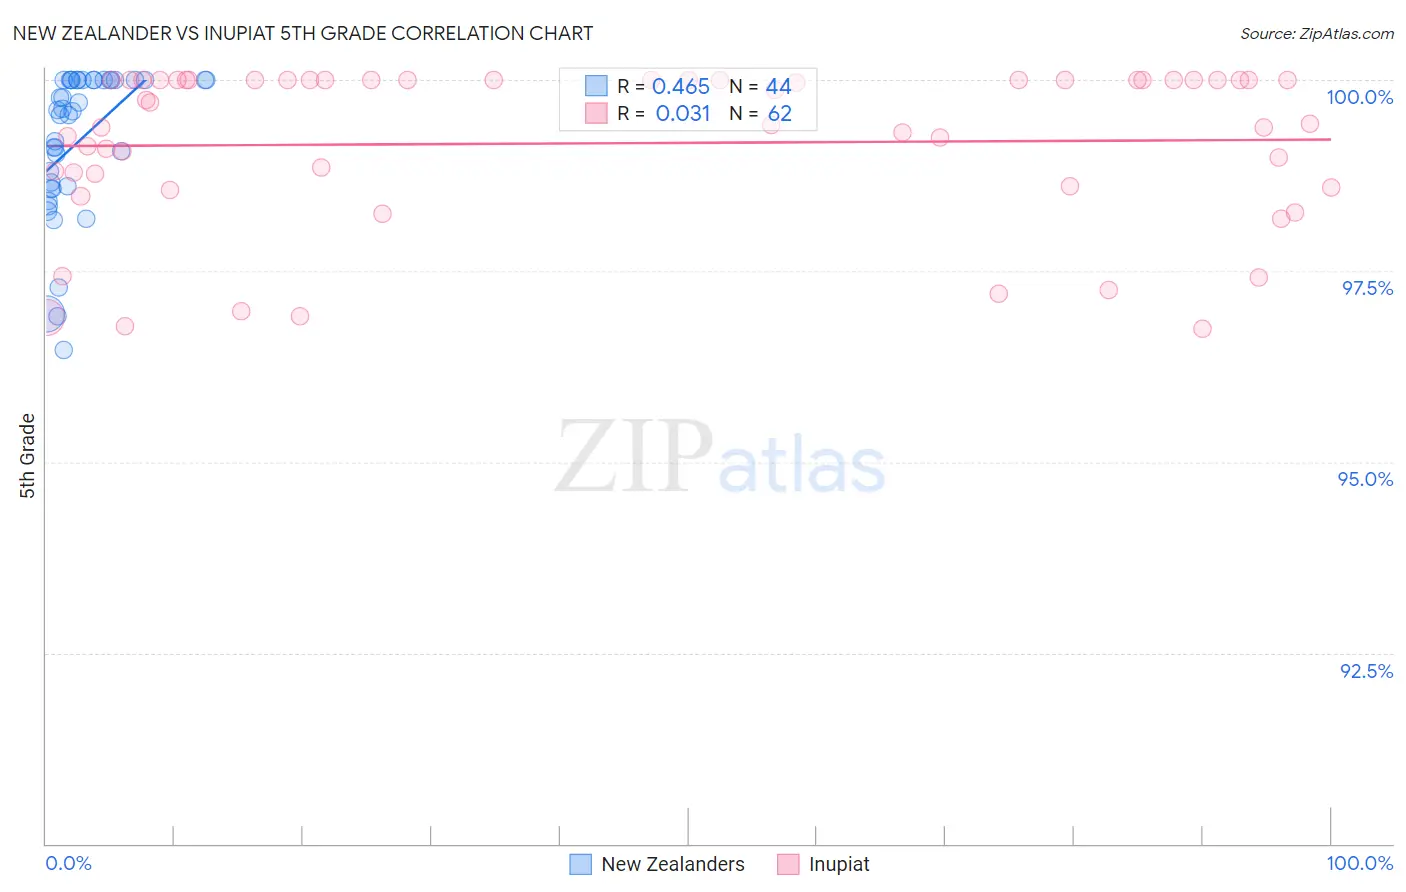
New Zealander vs Inupiat 5th Grade Correlation Chart
The statistical analysis conducted on geographies consisting of 106,912,544 people shows a moderate positive correlation between the proportion of New Zealanders and percentage of population with at least 5th grade education in the United States with a correlation coefficient (R) of 0.465 and weighted average of 97.9%. Similarly, the statistical analysis conducted on geographies consisting of 96,348,974 people shows no correlation between the proportion of Inupiat and percentage of population with at least 5th grade education in the United States with a correlation coefficient (R) of 0.031 and weighted average of 98.4%, a difference of 0.49%.
5th Grade Correlation Summary
| Measurement | New Zealander | Inupiat |
| Minimum | 96.5% | 96.7% |
| Maximum | 100.0% | 100.0% |
| Range | 3.5% | 3.3% |
| Mean | 99.2% | 99.2% |
| Median | 99.6% | 99.6% |
| Interquartile 25% (IQ1) | 98.6% | 98.6% |
| Interquartile 75% (IQ3) | 100.0% | 100.0% |
| Interquartile Range (IQR) | 1.4% | 1.4% |
| Standard Deviation (Sample) | 0.96% | 1.0% |
| Standard Deviation (Population) | 0.95% | 1.0% |
Similar Demographics by 5th Grade
Demographics Similar to New Zealanders by 5th Grade
In terms of 5th grade, the demographic groups most similar to New Zealanders are Canadian (97.9%, a difference of 0.0%), Immigrants from Austria (97.9%, a difference of 0.0%), Immigrants from Northern Europe (97.9%, a difference of 0.010%), Cajun (97.9%, a difference of 0.010%), and Russian (97.9%, a difference of 0.020%).
| Demographics | Rating | Rank | 5th Grade |
| Immigrants | Canada | 99.7 /100 | #60 | Exceptional 97.9% |
| Serbians | 99.7 /100 | #61 | Exceptional 97.9% |
| Immigrants | North America | 99.7 /100 | #62 | Exceptional 97.9% |
| Russians | 99.7 /100 | #63 | Exceptional 97.9% |
| Immigrants | Northern Europe | 99.6 /100 | #64 | Exceptional 97.9% |
| Canadians | 99.6 /100 | #65 | Exceptional 97.9% |
| Immigrants | Austria | 99.6 /100 | #66 | Exceptional 97.9% |
| New Zealanders | 99.6 /100 | #67 | Exceptional 97.9% |
| Cajuns | 99.6 /100 | #68 | Exceptional 97.9% |
| Kiowa | 99.5 /100 | #69 | Exceptional 97.9% |
| Iranians | 99.5 /100 | #70 | Exceptional 97.9% |
| Chickasaw | 99.5 /100 | #71 | Exceptional 97.9% |
| Macedonians | 99.4 /100 | #72 | Exceptional 97.9% |
| Cherokee | 99.4 /100 | #73 | Exceptional 97.8% |
| Lumbee | 99.3 /100 | #74 | Exceptional 97.8% |
Demographics Similar to Inupiat by 5th Grade
In terms of 5th grade, the demographic groups most similar to Inupiat are Slovene (98.3%, a difference of 0.020%), Slovak (98.4%, a difference of 0.030%), German (98.4%, a difference of 0.030%), Norwegian (98.4%, a difference of 0.050%), and Tsimshian (98.4%, a difference of 0.050%).
| Demographics | Rating | Rank | 5th Grade |
| Crow | 100.0 /100 | #1 | Exceptional 99.5% |
| Welsh | 100.0 /100 | #2 | Exceptional 98.6% |
| Norwegians | 100.0 /100 | #3 | Exceptional 98.4% |
| Tsimshian | 100.0 /100 | #4 | Exceptional 98.4% |
| Slovaks | 100.0 /100 | #5 | Exceptional 98.4% |
| Germans | 100.0 /100 | #6 | Exceptional 98.4% |
| Inupiat | 100.0 /100 | #7 | Exceptional 98.4% |
| Slovenes | 100.0 /100 | #8 | Exceptional 98.3% |
| Swedes | 100.0 /100 | #9 | Exceptional 98.3% |
| English | 100.0 /100 | #10 | Exceptional 98.3% |
| Alaskan Athabascans | 100.0 /100 | #11 | Exceptional 98.3% |
| Carpatho Rusyns | 100.0 /100 | #12 | Exceptional 98.3% |
| Tlingit-Haida | 100.0 /100 | #13 | Exceptional 98.3% |
| Dutch | 100.0 /100 | #14 | Exceptional 98.3% |
| Scottish | 100.0 /100 | #15 | Exceptional 98.3% |