New Zealander vs Honduran Doctorate Degree
COMPARE
New Zealander
Honduran
Doctorate Degree
Doctorate Degree Comparison
New Zealanders
Hondurans
2.5%
DOCTORATE DEGREE
100.0/ 100
METRIC RATING
42nd/ 347
METRIC RANK
1.4%
DOCTORATE DEGREE
0.1/ 100
METRIC RATING
301st/ 347
METRIC RANK
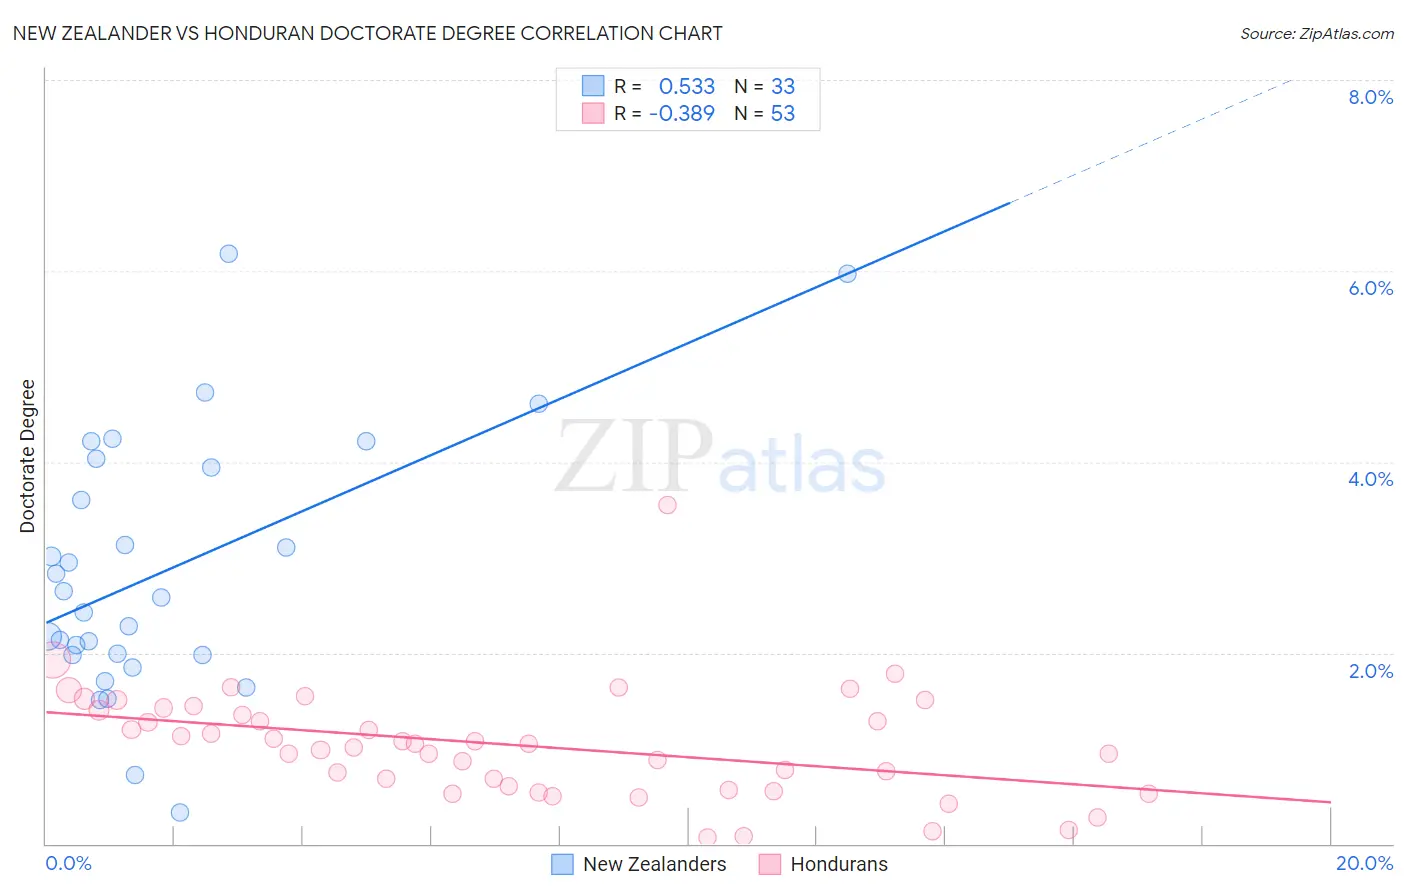
New Zealander vs Honduran Doctorate Degree Correlation Chart
The statistical analysis conducted on geographies consisting of 106,690,602 people shows a substantial positive correlation between the proportion of New Zealanders and percentage of population with at least doctorate degree education in the United States with a correlation coefficient (R) of 0.533 and weighted average of 2.5%. Similarly, the statistical analysis conducted on geographies consisting of 353,493,609 people shows a mild negative correlation between the proportion of Hondurans and percentage of population with at least doctorate degree education in the United States with a correlation coefficient (R) of -0.389 and weighted average of 1.4%, a difference of 80.4%.
Doctorate Degree Correlation Summary
| Measurement | New Zealander | Honduran |
| Minimum | 0.33% | 0.068% |
| Maximum | 6.2% | 3.5% |
| Range | 5.9% | 3.5% |
| Mean | 2.9% | 1.0% |
| Median | 2.6% | 1.0% |
| Interquartile 25% (IQ1) | 2.0% | 0.59% |
| Interquartile 75% (IQ3) | 4.0% | 1.4% |
| Interquartile Range (IQR) | 2.0% | 0.82% |
| Standard Deviation (Sample) | 1.4% | 0.59% |
| Standard Deviation (Population) | 1.3% | 0.58% |
Similar Demographics by Doctorate Degree
Demographics Similar to New Zealanders by Doctorate Degree
In terms of doctorate degree, the demographic groups most similar to New Zealanders are Immigrants from Russia (2.5%, a difference of 0.63%), Soviet Union (2.5%, a difference of 0.94%), Estonian (2.5%, a difference of 0.96%), Immigrants from Netherlands (2.5%, a difference of 0.97%), and Immigrants from Ireland (2.5%, a difference of 1.4%).
| Demographics | Rating | Rank | Doctorate Degree |
| Immigrants | Malaysia | 100.0 /100 | #35 | Exceptional 2.6% |
| Immigrants | Spain | 100.0 /100 | #36 | Exceptional 2.6% |
| Immigrants | Kuwait | 100.0 /100 | #37 | Exceptional 2.6% |
| Russians | 100.0 /100 | #38 | Exceptional 2.6% |
| Immigrants | Ireland | 100.0 /100 | #39 | Exceptional 2.5% |
| Estonians | 100.0 /100 | #40 | Exceptional 2.5% |
| Immigrants | Russia | 100.0 /100 | #41 | Exceptional 2.5% |
| New Zealanders | 100.0 /100 | #42 | Exceptional 2.5% |
| Soviet Union | 100.0 /100 | #43 | Exceptional 2.5% |
| Immigrants | Netherlands | 100.0 /100 | #44 | Exceptional 2.5% |
| Immigrants | South Africa | 100.0 /100 | #45 | Exceptional 2.4% |
| Immigrants | Austria | 100.0 /100 | #46 | Exceptional 2.4% |
| Immigrants | Western Europe | 100.0 /100 | #47 | Exceptional 2.4% |
| Asians | 100.0 /100 | #48 | Exceptional 2.4% |
| Immigrants | Asia | 100.0 /100 | #49 | Exceptional 2.4% |
Demographics Similar to Hondurans by Doctorate Degree
In terms of doctorate degree, the demographic groups most similar to Hondurans are Immigrants from Guatemala (1.4%, a difference of 0.070%), Shoshone (1.4%, a difference of 0.33%), Immigrants from Dominica (1.4%, a difference of 0.36%), Belizean (1.4%, a difference of 0.40%), and Mexican American Indian (1.4%, a difference of 0.42%).
| Demographics | Rating | Rank | Doctorate Degree |
| Samoans | 0.2 /100 | #294 | Tragic 1.4% |
| Guatemalans | 0.2 /100 | #295 | Tragic 1.4% |
| Immigrants | Ecuador | 0.2 /100 | #296 | Tragic 1.4% |
| Tsimshian | 0.2 /100 | #297 | Tragic 1.4% |
| Puerto Ricans | 0.1 /100 | #298 | Tragic 1.4% |
| Belizeans | 0.1 /100 | #299 | Tragic 1.4% |
| Immigrants | Guatemala | 0.1 /100 | #300 | Tragic 1.4% |
| Hondurans | 0.1 /100 | #301 | Tragic 1.4% |
| Shoshone | 0.1 /100 | #302 | Tragic 1.4% |
| Immigrants | Dominica | 0.1 /100 | #303 | Tragic 1.4% |
| Mexican American Indians | 0.1 /100 | #304 | Tragic 1.4% |
| Pennsylvania Germans | 0.1 /100 | #305 | Tragic 1.4% |
| Guyanese | 0.1 /100 | #306 | Tragic 1.4% |
| Cubans | 0.1 /100 | #307 | Tragic 1.4% |
| Immigrants | Laos | 0.1 /100 | #308 | Tragic 1.4% |