Nepalese vs Immigrants from St. Vincent and the Grenadines 12th Grade, No Diploma
COMPARE
Nepalese
Immigrants from St. Vincent and the Grenadines
12th Grade, No Diploma
12th Grade, No Diploma Comparison
Nepalese
Immigrants from St. Vincent and the Grenadines
88.1%
12TH GRADE, NO DIPLOMA
0.0/ 100
METRIC RATING
299th/ 347
METRIC RANK
88.9%
12TH GRADE, NO DIPLOMA
0.0/ 100
METRIC RATING
278th/ 347
METRIC RANK
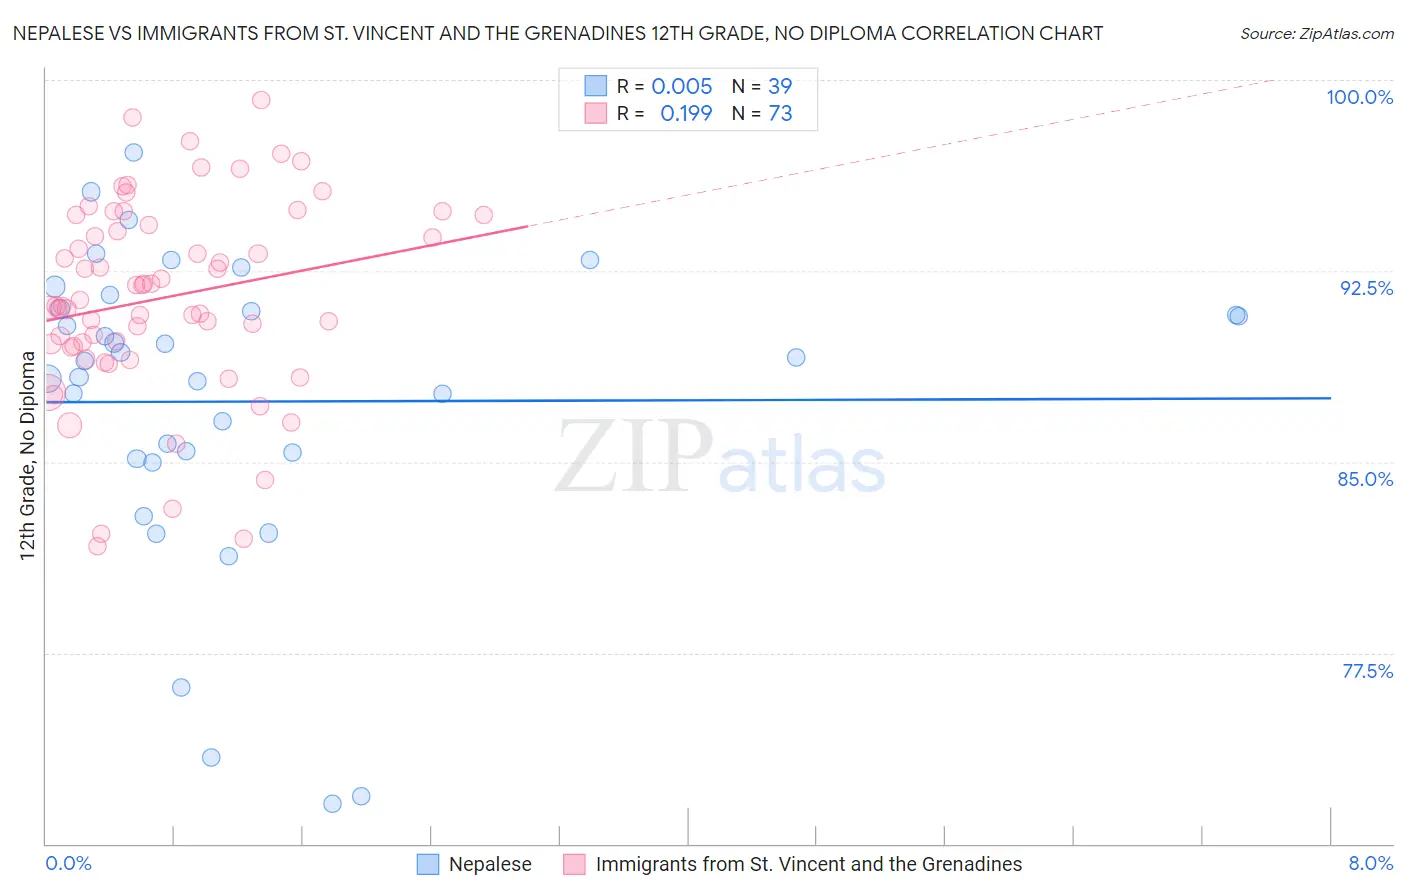
Nepalese vs Immigrants from St. Vincent and the Grenadines 12th Grade, No Diploma Correlation Chart
The statistical analysis conducted on geographies consisting of 24,519,269 people shows no correlation between the proportion of Nepalese and percentage of population with at least 12th grade (no diploma) education in the United States with a correlation coefficient (R) of 0.005 and weighted average of 88.1%. Similarly, the statistical analysis conducted on geographies consisting of 56,191,418 people shows a poor positive correlation between the proportion of Immigrants from St. Vincent and the Grenadines and percentage of population with at least 12th grade (no diploma) education in the United States with a correlation coefficient (R) of 0.199 and weighted average of 88.9%, a difference of 0.94%.
12th Grade, No Diploma Correlation Summary
| Measurement | Nepalese | Immigrants from St. Vincent and the Grenadines |
| Minimum | 71.6% | 81.7% |
| Maximum | 97.2% | 99.2% |
| Range | 25.6% | 17.5% |
| Mean | 87.4% | 91.4% |
| Median | 89.0% | 91.1% |
| Interquartile 25% (IQ1) | 85.1% | 89.5% |
| Interquartile 75% (IQ3) | 91.0% | 94.5% |
| Interquartile Range (IQR) | 5.9% | 5.0% |
| Standard Deviation (Sample) | 6.1% | 3.8% |
| Standard Deviation (Population) | 6.0% | 3.8% |
Similar Demographics by 12th Grade, No Diploma
Demographics Similar to Nepalese by 12th Grade, No Diploma
In terms of 12th grade, no diploma, the demographic groups most similar to Nepalese are Immigrants from Haiti (88.2%, a difference of 0.040%), Immigrants from Guyana (88.1%, a difference of 0.050%), Immigrants from Cambodia (88.1%, a difference of 0.050%), Ecuadorian (88.0%, a difference of 0.080%), and Fijian (88.2%, a difference of 0.10%).
| Demographics | Rating | Rank | 12th Grade, No Diploma |
| Immigrants | Grenada | 0.0 /100 | #292 | Tragic 88.4% |
| Japanese | 0.0 /100 | #293 | Tragic 88.3% |
| Guyanese | 0.0 /100 | #294 | Tragic 88.3% |
| Immigrants | Immigrants | 0.0 /100 | #295 | Tragic 88.2% |
| Fijians | 0.0 /100 | #296 | Tragic 88.2% |
| Pueblo | 0.0 /100 | #297 | Tragic 88.2% |
| Immigrants | Haiti | 0.0 /100 | #298 | Tragic 88.2% |
| Nepalese | 0.0 /100 | #299 | Tragic 88.1% |
| Immigrants | Guyana | 0.0 /100 | #300 | Tragic 88.1% |
| Immigrants | Cambodia | 0.0 /100 | #301 | Tragic 88.1% |
| Ecuadorians | 0.0 /100 | #302 | Tragic 88.0% |
| Immigrants | Bangladesh | 0.0 /100 | #303 | Tragic 88.0% |
| Vietnamese | 0.0 /100 | #304 | Tragic 87.9% |
| Immigrants | Dominica | 0.0 /100 | #305 | Tragic 87.7% |
| Natives/Alaskans | 0.0 /100 | #306 | Tragic 87.7% |
Demographics Similar to Immigrants from St. Vincent and the Grenadines by 12th Grade, No Diploma
In terms of 12th grade, no diploma, the demographic groups most similar to Immigrants from St. Vincent and the Grenadines are Immigrants from Barbados (89.0%, a difference of 0.060%), Immigrants from Laos (88.9%, a difference of 0.070%), Immigrants from Burma/Myanmar (88.9%, a difference of 0.070%), Cuban (88.9%, a difference of 0.080%), and Immigrants from Congo (89.0%, a difference of 0.12%).
| Demographics | Rating | Rank | 12th Grade, No Diploma |
| Blacks/African Americans | 0.1 /100 | #271 | Tragic 89.3% |
| Malaysians | 0.1 /100 | #272 | Tragic 89.2% |
| Barbadians | 0.1 /100 | #273 | Tragic 89.1% |
| Cajuns | 0.1 /100 | #274 | Tragic 89.1% |
| Immigrants | Congo | 0.1 /100 | #275 | Tragic 89.0% |
| Ute | 0.1 /100 | #276 | Tragic 89.0% |
| Immigrants | Barbados | 0.0 /100 | #277 | Tragic 89.0% |
| Immigrants | St. Vincent and the Grenadines | 0.0 /100 | #278 | Tragic 88.9% |
| Immigrants | Laos | 0.0 /100 | #279 | Tragic 88.9% |
| Immigrants | Burma/Myanmar | 0.0 /100 | #280 | Tragic 88.9% |
| Cubans | 0.0 /100 | #281 | Tragic 88.9% |
| Immigrants | Vietnam | 0.0 /100 | #282 | Tragic 88.7% |
| Paiute | 0.0 /100 | #283 | Tragic 88.7% |
| Pennsylvania Germans | 0.0 /100 | #284 | Tragic 88.7% |
| Indonesians | 0.0 /100 | #285 | Tragic 88.6% |