Native/Alaskan vs Immigrants from Nigeria 8th Grade
COMPARE
Native/Alaskan
Immigrants from Nigeria
8th Grade
8th Grade Comparison
Natives/Alaskans
Immigrants from Nigeria
95.2%
8TH GRADE
2.3/ 100
METRIC RATING
238th/ 347
METRIC RANK
94.9%
8TH GRADE
0.4/ 100
METRIC RATING
262nd/ 347
METRIC RANK
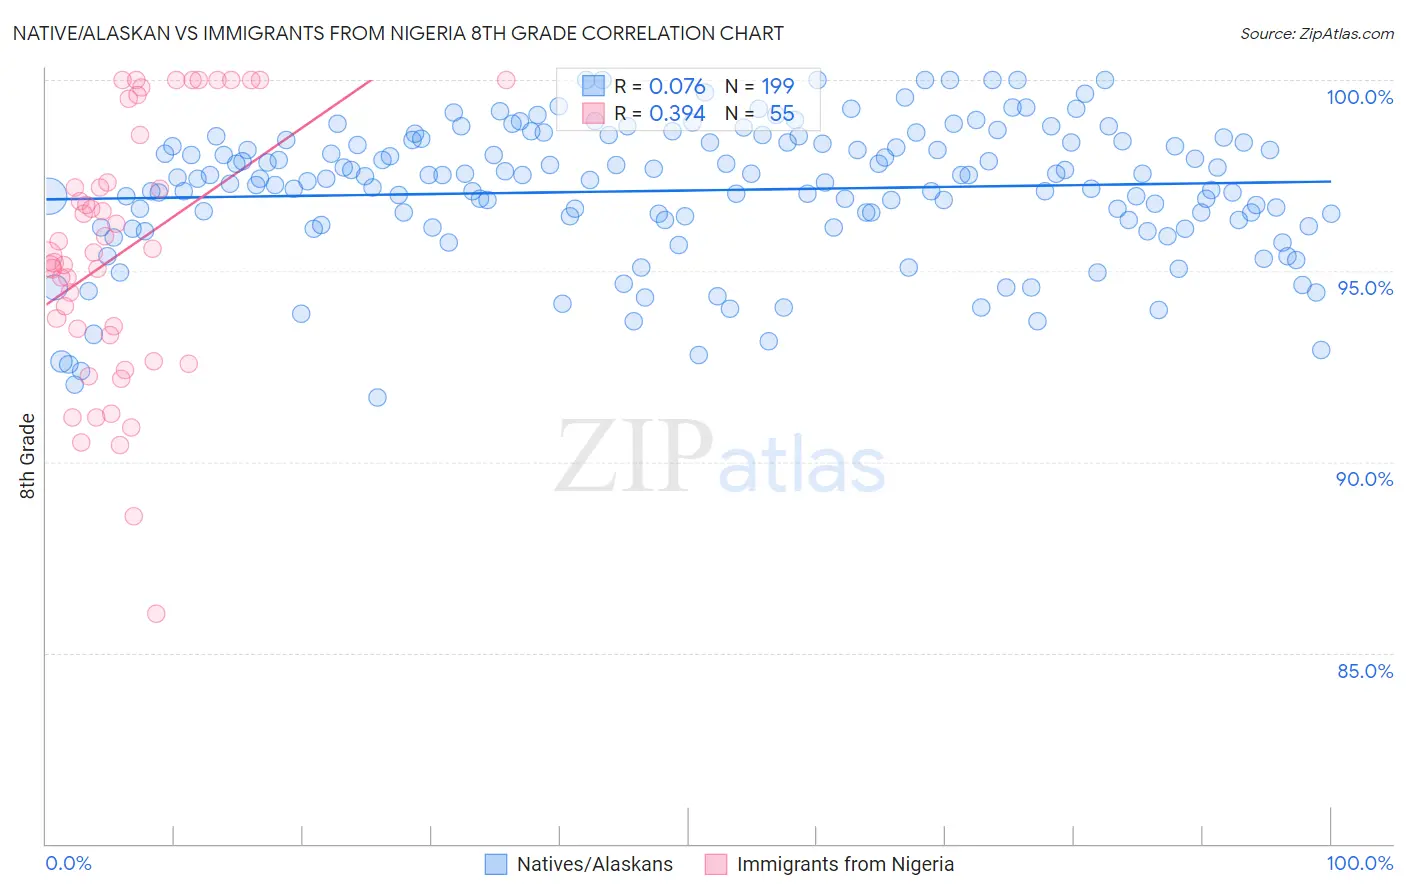
Native/Alaskan vs Immigrants from Nigeria 8th Grade Correlation Chart
The statistical analysis conducted on geographies consisting of 513,072,559 people shows a slight positive correlation between the proportion of Natives/Alaskans and percentage of population with at least 8th grade education in the United States with a correlation coefficient (R) of 0.076 and weighted average of 95.2%. Similarly, the statistical analysis conducted on geographies consisting of 283,441,873 people shows a mild positive correlation between the proportion of Immigrants from Nigeria and percentage of population with at least 8th grade education in the United States with a correlation coefficient (R) of 0.394 and weighted average of 94.9%, a difference of 0.28%.
8th Grade Correlation Summary
| Measurement | Native/Alaskan | Immigrants from Nigeria |
| Minimum | 91.7% | 86.0% |
| Maximum | 100.0% | 100.0% |
| Range | 8.3% | 14.0% |
| Mean | 97.1% | 95.5% |
| Median | 97.4% | 95.5% |
| Interquartile 25% (IQ1) | 96.2% | 93.3% |
| Interquartile 75% (IQ3) | 98.4% | 98.6% |
| Interquartile Range (IQR) | 2.2% | 5.2% |
| Standard Deviation (Sample) | 1.8% | 3.4% |
| Standard Deviation (Population) | 1.8% | 3.3% |
Similar Demographics by 8th Grade
Demographics Similar to Natives/Alaskans by 8th Grade
In terms of 8th grade, the demographic groups most similar to Natives/Alaskans are Immigrants from Sierra Leone (95.1%, a difference of 0.020%), Ethiopian (95.1%, a difference of 0.020%), Senegalese (95.2%, a difference of 0.030%), Immigrants from Africa (95.2%, a difference of 0.030%), and South American Indian (95.1%, a difference of 0.030%).
| Demographics | Rating | Rank | 8th Grade |
| Asians | 3.5 /100 | #231 | Tragic 95.2% |
| Indians (Asian) | 3.3 /100 | #232 | Tragic 95.2% |
| Immigrants | Asia | 3.1 /100 | #233 | Tragic 95.2% |
| Costa Ricans | 3.0 /100 | #234 | Tragic 95.2% |
| Nigerians | 2.9 /100 | #235 | Tragic 95.2% |
| Senegalese | 2.7 /100 | #236 | Tragic 95.2% |
| Immigrants | Africa | 2.7 /100 | #237 | Tragic 95.2% |
| Natives/Alaskans | 2.3 /100 | #238 | Tragic 95.2% |
| Immigrants | Sierra Leone | 2.1 /100 | #239 | Tragic 95.1% |
| Ethiopians | 2.0 /100 | #240 | Tragic 95.1% |
| South American Indians | 1.9 /100 | #241 | Tragic 95.1% |
| Tongans | 1.7 /100 | #242 | Tragic 95.1% |
| Paiute | 1.7 /100 | #243 | Tragic 95.1% |
| Immigrants | Middle Africa | 1.7 /100 | #244 | Tragic 95.1% |
| Jamaicans | 1.4 /100 | #245 | Tragic 95.1% |
Demographics Similar to Immigrants from Nigeria by 8th Grade
In terms of 8th grade, the demographic groups most similar to Immigrants from Nigeria are Immigrants from Hong Kong (94.9%, a difference of 0.010%), South American (94.9%, a difference of 0.010%), Yuman (94.9%, a difference of 0.010%), Immigrants from Costa Rica (94.9%, a difference of 0.020%), and Immigrants from Jamaica (94.9%, a difference of 0.050%).
| Demographics | Rating | Rank | 8th Grade |
| Immigrants | Somalia | 0.7 /100 | #255 | Tragic 95.0% |
| Colombians | 0.7 /100 | #256 | Tragic 95.0% |
| Afghans | 0.6 /100 | #257 | Tragic 94.9% |
| Immigrants | Congo | 0.6 /100 | #258 | Tragic 94.9% |
| Ghanaians | 0.6 /100 | #259 | Tragic 94.9% |
| Immigrants | Jamaica | 0.6 /100 | #260 | Tragic 94.9% |
| Immigrants | Costa Rica | 0.5 /100 | #261 | Tragic 94.9% |
| Immigrants | Nigeria | 0.4 /100 | #262 | Tragic 94.9% |
| Immigrants | Hong Kong | 0.4 /100 | #263 | Tragic 94.9% |
| South Americans | 0.4 /100 | #264 | Tragic 94.9% |
| Yuman | 0.4 /100 | #265 | Tragic 94.9% |
| West Indians | 0.3 /100 | #266 | Tragic 94.8% |
| Immigrants | Ghana | 0.3 /100 | #267 | Tragic 94.8% |
| Immigrants | Uruguay | 0.3 /100 | #268 | Tragic 94.8% |
| Immigrants | Thailand | 0.2 /100 | #269 | Tragic 94.8% |