Native Hawaiian vs German Russian 11th Grade
COMPARE
Native Hawaiian
German Russian
11th Grade
11th Grade Comparison
Native Hawaiians
German Russians
93.9%
11TH GRADE
99.8/ 100
METRIC RATING
65th/ 347
METRIC RANK
93.3%
11TH GRADE
96.4/ 100
METRIC RATING
121st/ 347
METRIC RANK
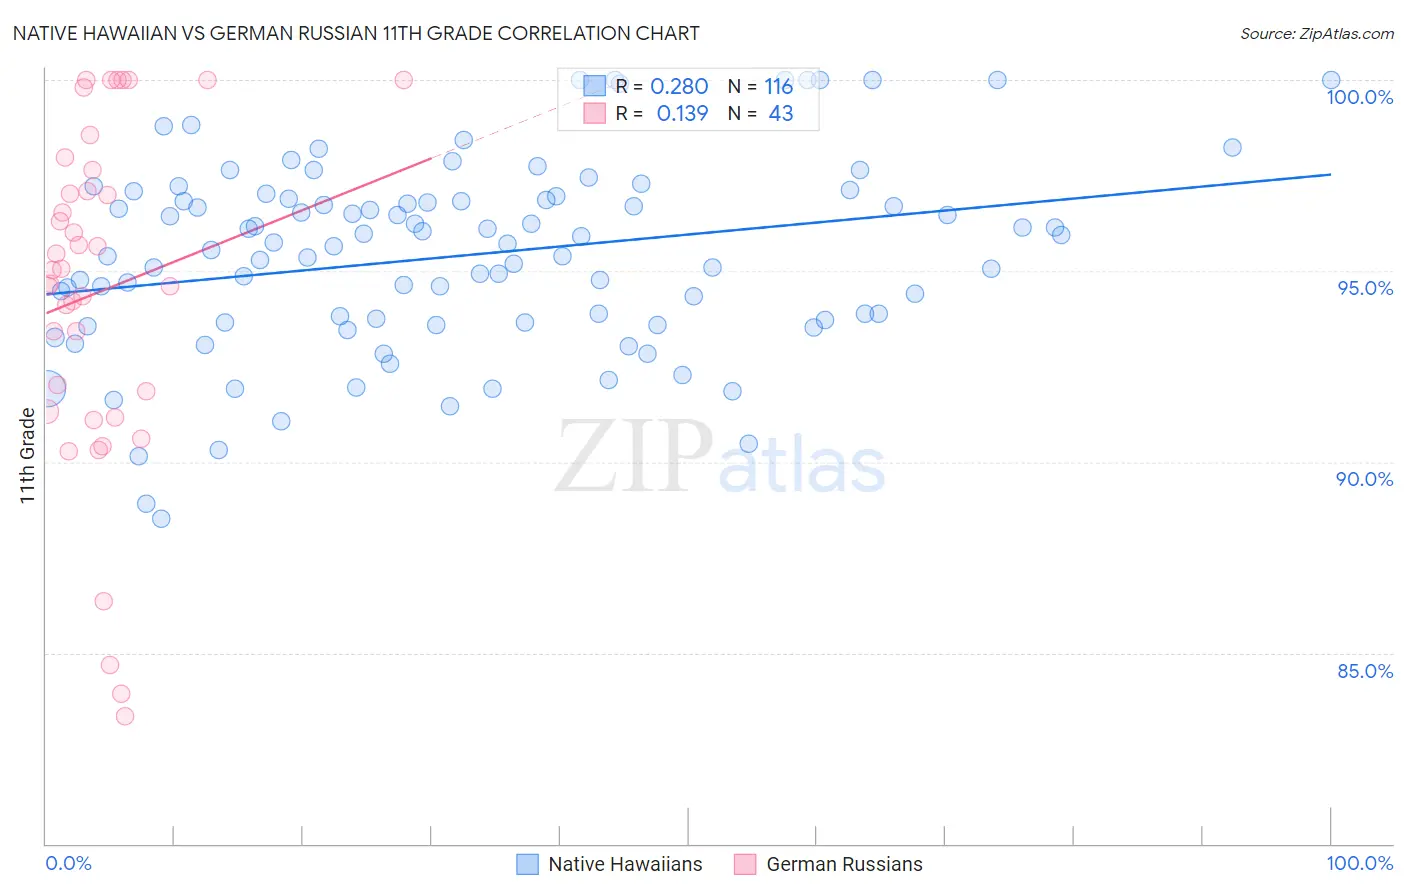
Native Hawaiian vs German Russian 11th Grade Correlation Chart
The statistical analysis conducted on geographies consisting of 332,119,254 people shows a weak positive correlation between the proportion of Native Hawaiians and percentage of population with at least 11th grade education in the United States with a correlation coefficient (R) of 0.280 and weighted average of 93.9%. Similarly, the statistical analysis conducted on geographies consisting of 96,461,984 people shows a poor positive correlation between the proportion of German Russians and percentage of population with at least 11th grade education in the United States with a correlation coefficient (R) of 0.139 and weighted average of 93.3%, a difference of 0.72%.
11th Grade Correlation Summary
| Measurement | Native Hawaiian | German Russian |
| Minimum | 88.5% | 83.3% |
| Maximum | 100.0% | 100.0% |
| Range | 11.5% | 16.7% |
| Mean | 95.4% | 94.5% |
| Median | 95.7% | 95.0% |
| Interquartile 25% (IQ1) | 93.7% | 91.3% |
| Interquartile 75% (IQ3) | 96.9% | 97.6% |
| Interquartile Range (IQR) | 3.2% | 6.3% |
| Standard Deviation (Sample) | 2.5% | 4.4% |
| Standard Deviation (Population) | 2.5% | 4.4% |
Similar Demographics by 11th Grade
Demographics Similar to Native Hawaiians by 11th Grade
In terms of 11th grade, the demographic groups most similar to Native Hawaiians are Immigrants from Sweden (93.9%, a difference of 0.0%), Alaskan Athabascan (93.9%, a difference of 0.020%), Immigrants from Netherlands (93.9%, a difference of 0.020%), Ukrainian (94.0%, a difference of 0.030%), and Zimbabwean (93.9%, a difference of 0.040%).
| Demographics | Rating | Rank | 11th Grade |
| Iranians | 99.9 /100 | #58 | Exceptional 94.0% |
| Bhutanese | 99.8 /100 | #59 | Exceptional 94.0% |
| Okinawans | 99.8 /100 | #60 | Exceptional 94.0% |
| Immigrants | Belgium | 99.8 /100 | #61 | Exceptional 94.0% |
| Austrians | 99.8 /100 | #62 | Exceptional 94.0% |
| Ukrainians | 99.8 /100 | #63 | Exceptional 94.0% |
| Immigrants | Sweden | 99.8 /100 | #64 | Exceptional 93.9% |
| Native Hawaiians | 99.8 /100 | #65 | Exceptional 93.9% |
| Alaskan Athabascans | 99.8 /100 | #66 | Exceptional 93.9% |
| Immigrants | Netherlands | 99.8 /100 | #67 | Exceptional 93.9% |
| Zimbabweans | 99.8 /100 | #68 | Exceptional 93.9% |
| Scotch-Irish | 99.8 /100 | #69 | Exceptional 93.9% |
| Immigrants | England | 99.7 /100 | #70 | Exceptional 93.8% |
| Immigrants | South Africa | 99.7 /100 | #71 | Exceptional 93.8% |
| Immigrants | Japan | 99.7 /100 | #72 | Exceptional 93.8% |
Demographics Similar to German Russians by 11th Grade
In terms of 11th grade, the demographic groups most similar to German Russians are Immigrants from Belarus (93.3%, a difference of 0.0%), Immigrants from Russia (93.3%, a difference of 0.020%), Immigrants from Greece (93.2%, a difference of 0.030%), Immigrants from Eastern Europe (93.2%, a difference of 0.030%), and Immigrants from Korea (93.3%, a difference of 0.050%).
| Demographics | Rating | Rank | 11th Grade |
| Jordanians | 97.8 /100 | #114 | Exceptional 93.4% |
| Palestinians | 97.7 /100 | #115 | Exceptional 93.4% |
| Immigrants | Hungary | 97.5 /100 | #116 | Exceptional 93.4% |
| Whites/Caucasians | 97.4 /100 | #117 | Exceptional 93.3% |
| Immigrants | Korea | 97.0 /100 | #118 | Exceptional 93.3% |
| Israelis | 97.0 /100 | #119 | Exceptional 93.3% |
| Immigrants | Russia | 96.6 /100 | #120 | Exceptional 93.3% |
| German Russians | 96.4 /100 | #121 | Exceptional 93.3% |
| Immigrants | Belarus | 96.3 /100 | #122 | Exceptional 93.3% |
| Immigrants | Greece | 95.9 /100 | #123 | Exceptional 93.2% |
| Immigrants | Eastern Europe | 95.9 /100 | #124 | Exceptional 93.2% |
| Immigrants | Sri Lanka | 95.6 /100 | #125 | Exceptional 93.2% |
| Basques | 95.2 /100 | #126 | Exceptional 93.2% |
| Immigrants | Kazakhstan | 92.4 /100 | #127 | Exceptional 93.1% |
| Immigrants | Jordan | 92.4 /100 | #128 | Exceptional 93.1% |