Mexican American Indian vs Lumbee 3rd Grade
COMPARE
Mexican American Indian
Lumbee
3rd Grade
3rd Grade Comparison
Mexican American Indians
Lumbee
96.4%
3RD GRADE
0.0/ 100
METRIC RATING
325th/ 347
METRIC RANK
98.3%
3RD GRADE
99.8/ 100
METRIC RATING
48th/ 347
METRIC RANK
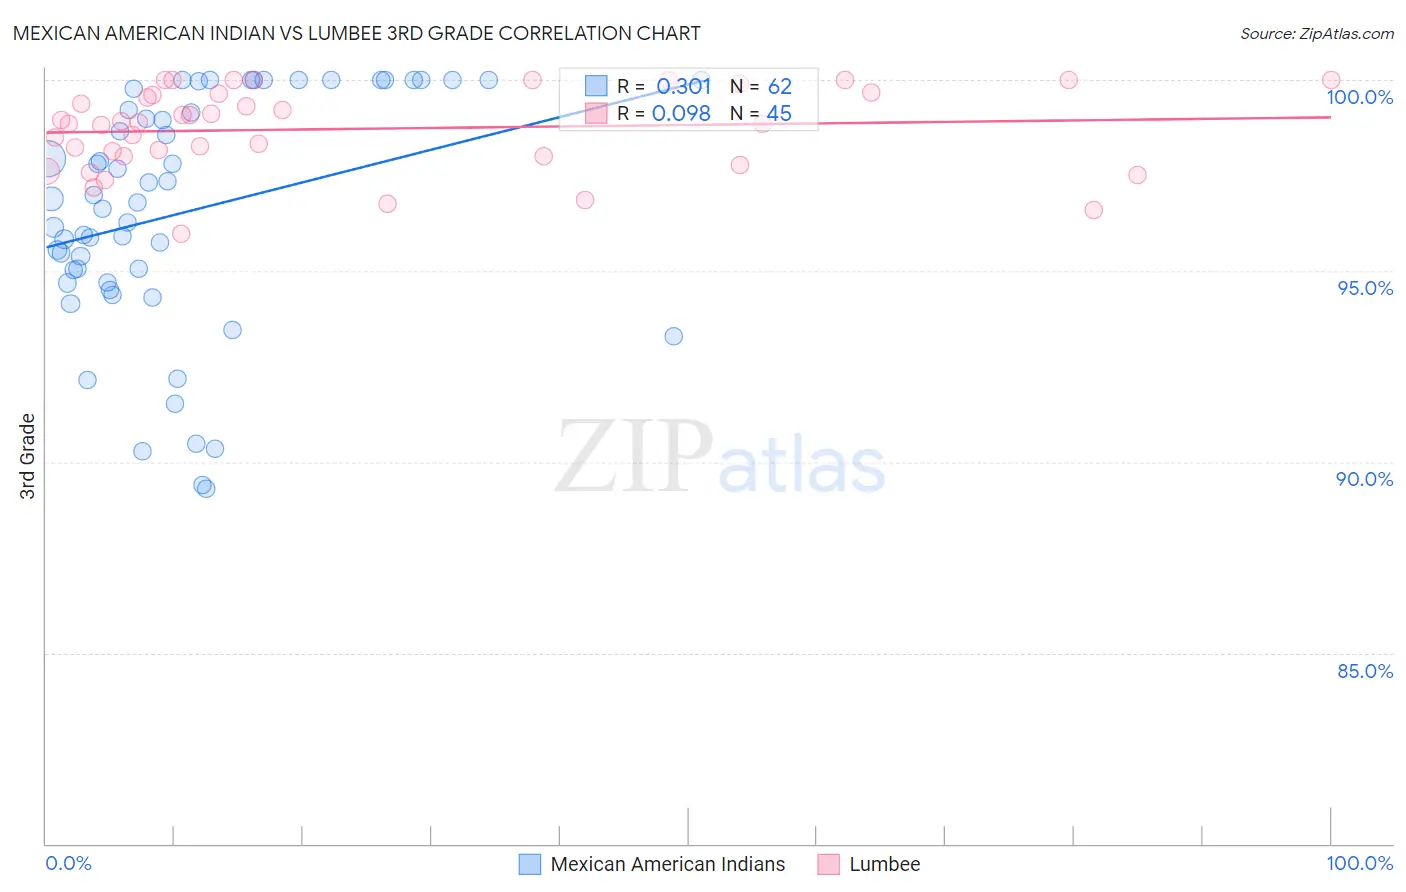
Mexican American Indian vs Lumbee 3rd Grade Correlation Chart
The statistical analysis conducted on geographies consisting of 317,619,717 people shows a mild positive correlation between the proportion of Mexican American Indians and percentage of population with at least 3rd grade education in the United States with a correlation coefficient (R) of 0.301 and weighted average of 96.4%. Similarly, the statistical analysis conducted on geographies consisting of 92,298,549 people shows a slight positive correlation between the proportion of Lumbee and percentage of population with at least 3rd grade education in the United States with a correlation coefficient (R) of 0.098 and weighted average of 98.3%, a difference of 2.0%.
3rd Grade Correlation Summary
| Measurement | Mexican American Indian | Lumbee |
| Minimum | 89.3% | 96.0% |
| Maximum | 100.0% | 100.0% |
| Range | 10.7% | 4.0% |
| Mean | 96.6% | 98.7% |
| Median | 96.8% | 98.9% |
| Interquartile 25% (IQ1) | 94.7% | 98.0% |
| Interquartile 75% (IQ3) | 99.8% | 99.7% |
| Interquartile Range (IQR) | 5.1% | 1.7% |
| Standard Deviation (Sample) | 3.1% | 1.1% |
| Standard Deviation (Population) | 3.0% | 1.1% |
Similar Demographics by 3rd Grade
Demographics Similar to Mexican American Indians by 3rd Grade
In terms of 3rd grade, the demographic groups most similar to Mexican American Indians are Dominican (96.4%, a difference of 0.010%), Immigrants from Vietnam (96.4%, a difference of 0.030%), Japanese (96.4%, a difference of 0.040%), Bangladeshi (96.3%, a difference of 0.050%), and Immigrants from Honduras (96.3%, a difference of 0.070%).
| Demographics | Rating | Rank | 3rd Grade |
| Hispanics or Latinos | 0.0 /100 | #318 | Tragic 96.5% |
| Vietnamese | 0.0 /100 | #319 | Tragic 96.5% |
| Immigrants | Nicaragua | 0.0 /100 | #320 | Tragic 96.5% |
| Indonesians | 0.0 /100 | #321 | Tragic 96.5% |
| Immigrants | Belize | 0.0 /100 | #322 | Tragic 96.5% |
| Hondurans | 0.0 /100 | #323 | Tragic 96.5% |
| Dominicans | 0.0 /100 | #324 | Tragic 96.4% |
| Mexican American Indians | 0.0 /100 | #325 | Tragic 96.4% |
| Immigrants | Vietnam | 0.0 /100 | #326 | Tragic 96.4% |
| Japanese | 0.0 /100 | #327 | Tragic 96.4% |
| Bangladeshis | 0.0 /100 | #328 | Tragic 96.3% |
| Immigrants | Honduras | 0.0 /100 | #329 | Tragic 96.3% |
| Immigrants | Armenia | 0.0 /100 | #330 | Tragic 96.3% |
| Immigrants | Latin America | 0.0 /100 | #331 | Tragic 96.2% |
| Mexicans | 0.0 /100 | #332 | Tragic 96.2% |
Demographics Similar to Lumbee by 3rd Grade
In terms of 3rd grade, the demographic groups most similar to Lumbee are Czechoslovakian (98.3%, a difference of 0.0%), Ottawa (98.3%, a difference of 0.010%), Estonian (98.3%, a difference of 0.010%), Celtic (98.3%, a difference of 0.010%), and Australian (98.3%, a difference of 0.020%).
| Demographics | Rating | Rank | 3rd Grade |
| Luxembourgers | 99.9 /100 | #41 | Exceptional 98.3% |
| Belgians | 99.9 /100 | #42 | Exceptional 98.3% |
| Northern Europeans | 99.9 /100 | #43 | Exceptional 98.3% |
| Hungarians | 99.9 /100 | #44 | Exceptional 98.3% |
| Native Hawaiians | 99.9 /100 | #45 | Exceptional 98.3% |
| Ottawa | 99.8 /100 | #46 | Exceptional 98.3% |
| Czechoslovakians | 99.8 /100 | #47 | Exceptional 98.3% |
| Lumbee | 99.8 /100 | #48 | Exceptional 98.3% |
| Estonians | 99.8 /100 | #49 | Exceptional 98.3% |
| Celtics | 99.8 /100 | #50 | Exceptional 98.3% |
| Australians | 99.8 /100 | #51 | Exceptional 98.3% |
| Whites/Caucasians | 99.8 /100 | #52 | Exceptional 98.3% |
| Immigrants | Scotland | 99.8 /100 | #53 | Exceptional 98.3% |
| Bulgarians | 99.8 /100 | #54 | Exceptional 98.3% |
| Americans | 99.8 /100 | #55 | Exceptional 98.3% |