Menominee vs Immigrants from Pakistan 10th Grade
COMPARE
Menominee
Immigrants from Pakistan
10th Grade
10th Grade Comparison
Menominee
Immigrants from Pakistan
94.6%
10TH GRADE
98.3/ 100
METRIC RATING
95th/ 347
METRIC RANK
93.6%
10TH GRADE
32.5/ 100
METRIC RATING
189th/ 347
METRIC RANK
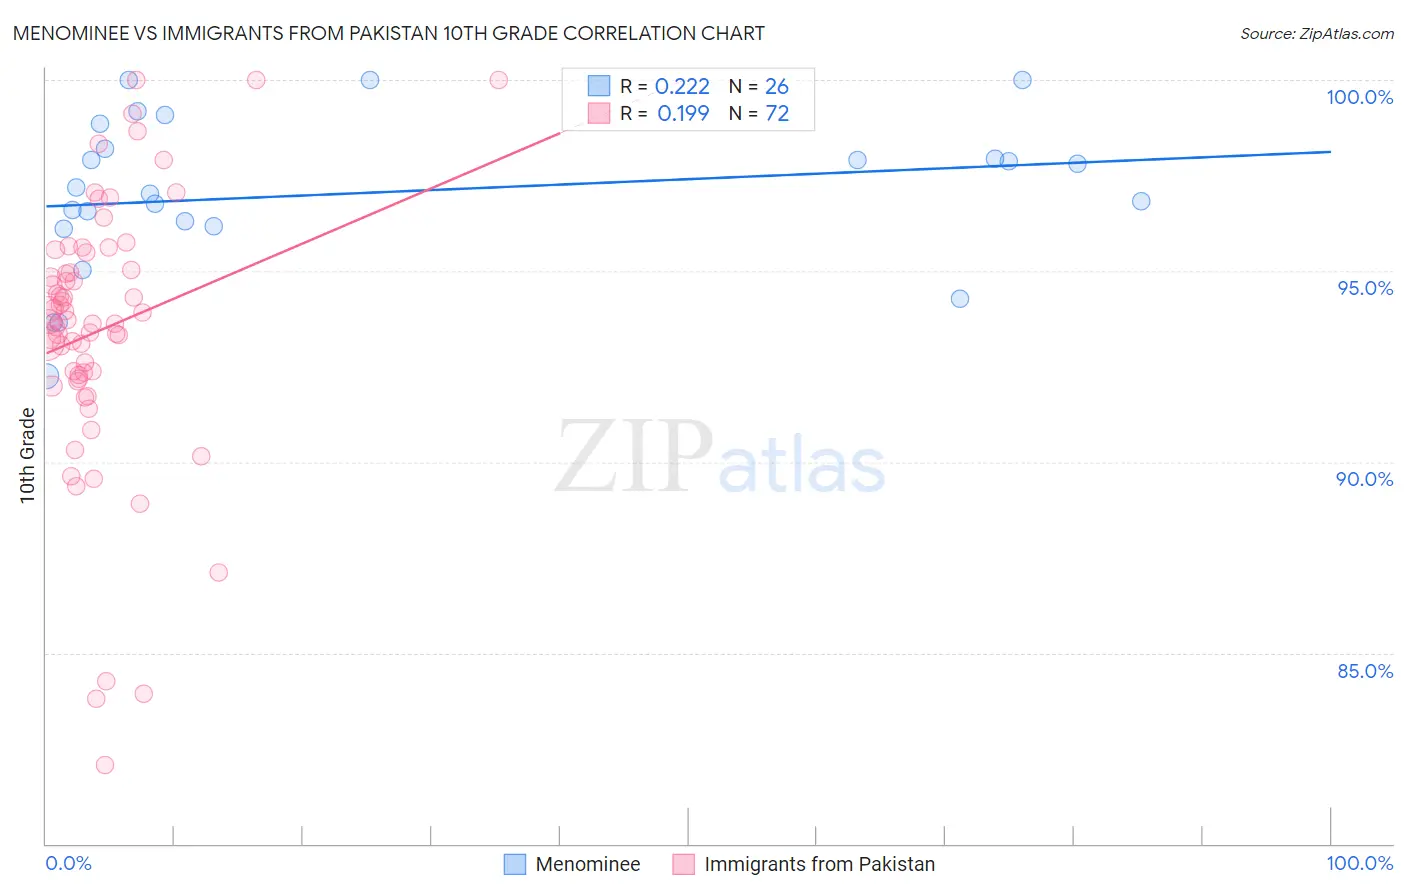
Menominee vs Immigrants from Pakistan 10th Grade Correlation Chart
The statistical analysis conducted on geographies consisting of 45,778,979 people shows a weak positive correlation between the proportion of Menominee and percentage of population with at least 10th grade education in the United States with a correlation coefficient (R) of 0.222 and weighted average of 94.6%. Similarly, the statistical analysis conducted on geographies consisting of 283,836,244 people shows a poor positive correlation between the proportion of Immigrants from Pakistan and percentage of population with at least 10th grade education in the United States with a correlation coefficient (R) of 0.199 and weighted average of 93.6%, a difference of 1.1%.
10th Grade Correlation Summary
| Measurement | Menominee | Immigrants from Pakistan |
| Minimum | 92.2% | 82.1% |
| Maximum | 100.0% | 100.0% |
| Range | 7.8% | 17.9% |
| Mean | 97.0% | 93.4% |
| Median | 97.1% | 93.7% |
| Interquartile 25% (IQ1) | 96.2% | 92.2% |
| Interquartile 75% (IQ3) | 98.2% | 95.3% |
| Interquartile Range (IQR) | 2.0% | 3.0% |
| Standard Deviation (Sample) | 2.0% | 3.5% |
| Standard Deviation (Population) | 2.0% | 3.5% |
Similar Demographics by 10th Grade
Demographics Similar to Menominee by 10th Grade
In terms of 10th grade, the demographic groups most similar to Menominee are Immigrants from Germany (94.6%, a difference of 0.0%), Immigrants from Switzerland (94.6%, a difference of 0.0%), Lebanese (94.6%, a difference of 0.0%), Yugoslavian (94.6%, a difference of 0.010%), and Soviet Union (94.6%, a difference of 0.010%).
| Demographics | Rating | Rank | 10th Grade |
| Immigrants | Japan | 99.0 /100 | #88 | Exceptional 94.7% |
| Immigrants | Moldova | 98.9 /100 | #89 | Exceptional 94.7% |
| South Africans | 98.8 /100 | #90 | Exceptional 94.7% |
| Whites/Caucasians | 98.8 /100 | #91 | Exceptional 94.7% |
| Yugoslavians | 98.4 /100 | #92 | Exceptional 94.6% |
| Soviet Union | 98.3 /100 | #93 | Exceptional 94.6% |
| Immigrants | Germany | 98.3 /100 | #94 | Exceptional 94.6% |
| Menominee | 98.3 /100 | #95 | Exceptional 94.6% |
| Immigrants | Switzerland | 98.3 /100 | #96 | Exceptional 94.6% |
| Lebanese | 98.3 /100 | #97 | Exceptional 94.6% |
| Immigrants | Bulgaria | 98.1 /100 | #98 | Exceptional 94.6% |
| Immigrants | France | 97.9 /100 | #99 | Exceptional 94.5% |
| Immigrants | South Central Asia | 97.8 /100 | #100 | Exceptional 94.5% |
| Syrians | 97.7 /100 | #101 | Exceptional 94.5% |
| Cambodians | 97.6 /100 | #102 | Exceptional 94.5% |
Demographics Similar to Immigrants from Pakistan by 10th Grade
In terms of 10th grade, the demographic groups most similar to Immigrants from Pakistan are Laotian (93.6%, a difference of 0.0%), Marshallese (93.6%, a difference of 0.010%), Liberian (93.6%, a difference of 0.020%), Yup'ik (93.6%, a difference of 0.020%), and Immigrants from Eastern Asia (93.6%, a difference of 0.030%).
| Demographics | Rating | Rank | 10th Grade |
| Colville | 38.8 /100 | #182 | Fair 93.6% |
| Guamanians/Chamorros | 37.1 /100 | #183 | Fair 93.6% |
| Choctaw | 36.6 /100 | #184 | Fair 93.6% |
| Sudanese | 36.6 /100 | #185 | Fair 93.6% |
| Immigrants | Eastern Asia | 35.1 /100 | #186 | Fair 93.6% |
| Liberians | 34.7 /100 | #187 | Fair 93.6% |
| Marshallese | 33.2 /100 | #188 | Fair 93.6% |
| Immigrants | Pakistan | 32.5 /100 | #189 | Fair 93.6% |
| Laotians | 32.1 /100 | #190 | Fair 93.6% |
| Yup'ik | 31.1 /100 | #191 | Fair 93.6% |
| Immigrants | Malaysia | 28.0 /100 | #192 | Fair 93.5% |
| Panamanians | 28.0 /100 | #193 | Fair 93.5% |
| Immigrants | Morocco | 26.9 /100 | #194 | Fair 93.5% |
| Cheyenne | 26.8 /100 | #195 | Fair 93.5% |
| Moroccans | 25.3 /100 | #196 | Fair 93.5% |