Maltese vs Uruguayan Nursery School
COMPARE
Maltese
Uruguayan
Nursery School
Nursery School Comparison
Maltese
Uruguayans
98.4%
NURSERY SCHOOL
99.7/ 100
METRIC RATING
65th/ 347
METRIC RANK
97.8%
NURSERY SCHOOL
7.1/ 100
METRIC RATING
216th/ 347
METRIC RANK
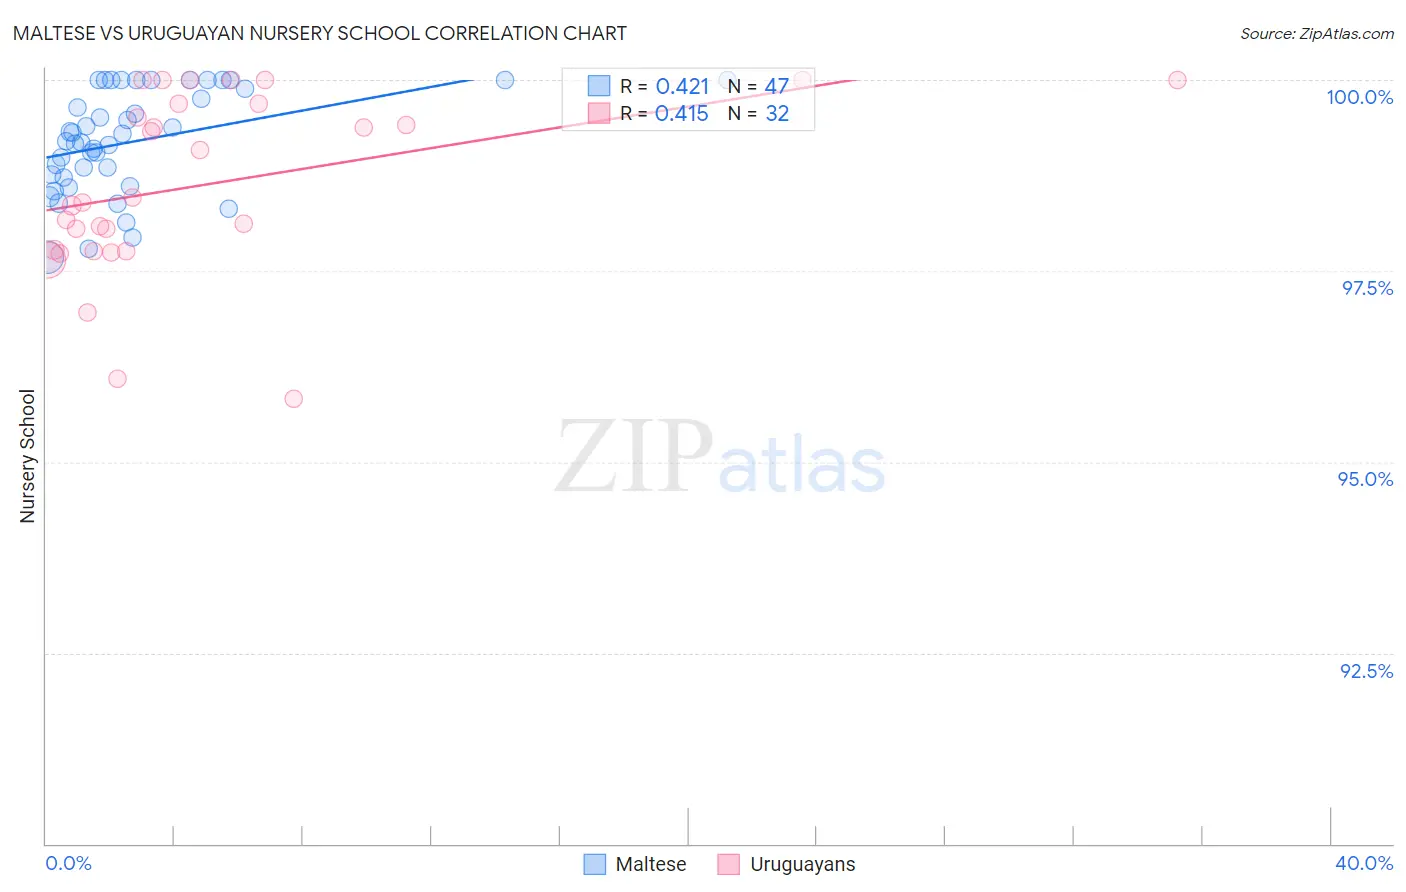
Maltese vs Uruguayan Nursery School Correlation Chart
The statistical analysis conducted on geographies consisting of 126,476,608 people shows a moderate positive correlation between the proportion of Maltese and percentage of population with at least nursery school education in the United States with a correlation coefficient (R) of 0.421 and weighted average of 98.4%. Similarly, the statistical analysis conducted on geographies consisting of 144,782,794 people shows a moderate positive correlation between the proportion of Uruguayans and percentage of population with at least nursery school education in the United States with a correlation coefficient (R) of 0.415 and weighted average of 97.8%, a difference of 0.64%.
Nursery School Correlation Summary
| Measurement | Maltese | Uruguayan |
| Minimum | 97.7% | 95.8% |
| Maximum | 100.0% | 100.0% |
| Range | 2.3% | 4.2% |
| Mean | 99.2% | 98.6% |
| Median | 99.2% | 98.4% |
| Interquartile 25% (IQ1) | 98.7% | 97.8% |
| Interquartile 75% (IQ3) | 100.0% | 99.7% |
| Interquartile Range (IQR) | 1.3% | 1.9% |
| Standard Deviation (Sample) | 0.67% | 1.2% |
| Standard Deviation (Population) | 0.66% | 1.1% |
Similar Demographics by Nursery School
Demographics Similar to Maltese by Nursery School
In terms of nursery school, the demographic groups most similar to Maltese are New Zealander (98.4%, a difference of 0.0%), Creek (98.4%, a difference of 0.0%), Immigrants from North America (98.4%, a difference of 0.0%), Greek (98.4%, a difference of 0.0%), and Bulgarian (98.4%, a difference of 0.010%).
| Demographics | Rating | Rank | Nursery School |
| Bulgarians | 99.8 /100 | #58 | Exceptional 98.4% |
| Immigrants | Canada | 99.8 /100 | #59 | Exceptional 98.4% |
| Slavs | 99.8 /100 | #60 | Exceptional 98.4% |
| New Zealanders | 99.7 /100 | #61 | Exceptional 98.4% |
| Creek | 99.7 /100 | #62 | Exceptional 98.4% |
| Immigrants | North America | 99.7 /100 | #63 | Exceptional 98.4% |
| Greeks | 99.7 /100 | #64 | Exceptional 98.4% |
| Maltese | 99.7 /100 | #65 | Exceptional 98.4% |
| Canadians | 99.7 /100 | #66 | Exceptional 98.4% |
| Immigrants | Northern Europe | 99.6 /100 | #67 | Exceptional 98.4% |
| Russians | 99.6 /100 | #68 | Exceptional 98.4% |
| Immigrants | Austria | 99.6 /100 | #69 | Exceptional 98.4% |
| Cheyenne | 99.6 /100 | #70 | Exceptional 98.4% |
| Serbians | 99.6 /100 | #71 | Exceptional 98.4% |
| Chickasaw | 99.6 /100 | #72 | Exceptional 98.4% |
Demographics Similar to Uruguayans by Nursery School
In terms of nursery school, the demographic groups most similar to Uruguayans are Bahamian (97.8%, a difference of 0.0%), Moroccan (97.8%, a difference of 0.010%), South American Indian (97.8%, a difference of 0.010%), Samoan (97.8%, a difference of 0.010%), and Immigrants from Bahamas (97.8%, a difference of 0.020%).
| Demographics | Rating | Rank | Nursery School |
| Costa Ricans | 11.3 /100 | #209 | Poor 97.8% |
| Immigrants | Oceania | 10.2 /100 | #210 | Poor 97.8% |
| Laotians | 9.8 /100 | #211 | Tragic 97.8% |
| Immigrants | Bahamas | 8.6 /100 | #212 | Tragic 97.8% |
| Moroccans | 8.3 /100 | #213 | Tragic 97.8% |
| South American Indians | 8.0 /100 | #214 | Tragic 97.8% |
| Bahamians | 7.4 /100 | #215 | Tragic 97.8% |
| Uruguayans | 7.1 /100 | #216 | Tragic 97.8% |
| Samoans | 6.3 /100 | #217 | Tragic 97.8% |
| Immigrants | Panama | 5.3 /100 | #218 | Tragic 97.8% |
| Immigrants | Morocco | 5.1 /100 | #219 | Tragic 97.8% |
| Immigrants | Zaire | 4.4 /100 | #220 | Tragic 97.8% |
| Tongans | 4.3 /100 | #221 | Tragic 97.8% |
| Immigrants | Syria | 4.0 /100 | #222 | Tragic 97.7% |
| Immigrants | Sudan | 3.9 /100 | #223 | Tragic 97.7% |