Maltese vs Shoshone Professional Degree
COMPARE
Maltese
Shoshone
Professional Degree
Professional Degree Comparison
Maltese
Shoshone
5.0%
PROFESSIONAL DEGREE
98.1/ 100
METRIC RATING
107th/ 347
METRIC RANK
3.3%
PROFESSIONAL DEGREE
0.1/ 100
METRIC RATING
308th/ 347
METRIC RANK
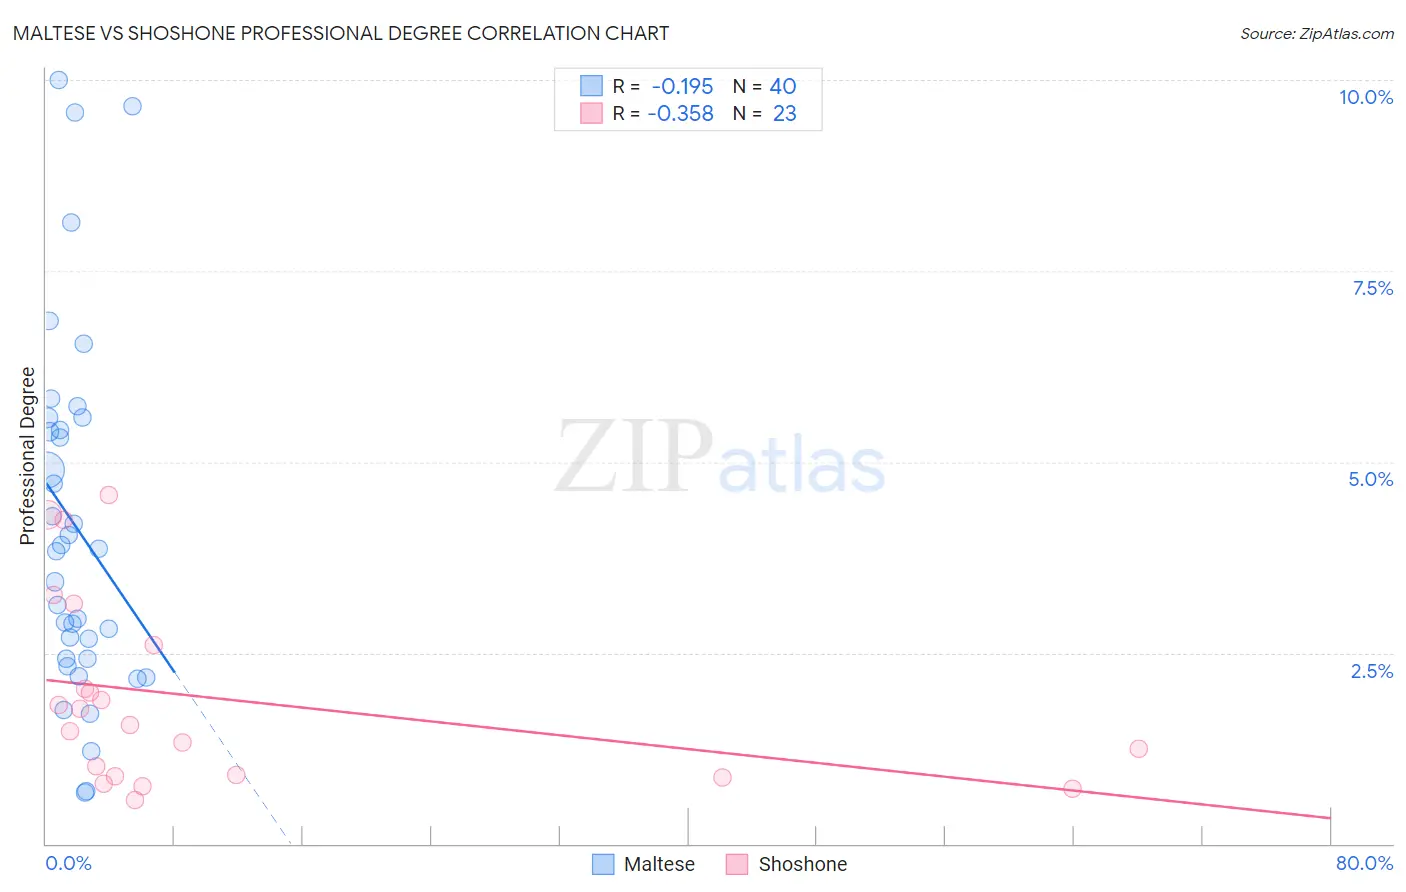
Maltese vs Shoshone Professional Degree Correlation Chart
The statistical analysis conducted on geographies consisting of 126,398,771 people shows a poor negative correlation between the proportion of Maltese and percentage of population with at least professional degree education in the United States with a correlation coefficient (R) of -0.195 and weighted average of 5.0%. Similarly, the statistical analysis conducted on geographies consisting of 66,513,785 people shows a mild negative correlation between the proportion of Shoshone and percentage of population with at least professional degree education in the United States with a correlation coefficient (R) of -0.358 and weighted average of 3.3%, a difference of 52.2%.
Professional Degree Correlation Summary
| Measurement | Maltese | Shoshone |
| Minimum | 0.68% | 0.57% |
| Maximum | 10.0% | 4.6% |
| Range | 9.3% | 4.0% |
| Mean | 4.2% | 1.9% |
| Median | 3.9% | 1.6% |
| Interquartile 25% (IQ1) | 2.4% | 0.89% |
| Interquartile 75% (IQ3) | 5.5% | 2.6% |
| Interquartile Range (IQR) | 3.1% | 1.7% |
| Standard Deviation (Sample) | 2.4% | 1.2% |
| Standard Deviation (Population) | 2.3% | 1.2% |
Similar Demographics by Professional Degree
Demographics Similar to Maltese by Professional Degree
In terms of professional degree, the demographic groups most similar to Maltese are Immigrants from Southern Europe (5.0%, a difference of 0.040%), British (5.0%, a difference of 0.060%), Immigrants from Ukraine (5.0%, a difference of 0.12%), Immigrants from Uganda (5.0%, a difference of 0.15%), and Arab (5.0%, a difference of 0.17%).
| Demographics | Rating | Rank | Professional Degree |
| Ugandans | 98.8 /100 | #100 | Exceptional 5.1% |
| Immigrants | Egypt | 98.5 /100 | #101 | Exceptional 5.1% |
| Ukrainians | 98.5 /100 | #102 | Exceptional 5.1% |
| Immigrants | Northern Africa | 98.4 /100 | #103 | Exceptional 5.1% |
| Arabs | 98.2 /100 | #104 | Exceptional 5.0% |
| Immigrants | Uganda | 98.2 /100 | #105 | Exceptional 5.0% |
| Immigrants | Ukraine | 98.2 /100 | #106 | Exceptional 5.0% |
| Maltese | 98.1 /100 | #107 | Exceptional 5.0% |
| Immigrants | Southern Europe | 98.1 /100 | #108 | Exceptional 5.0% |
| British | 98.0 /100 | #109 | Exceptional 5.0% |
| Lebanese | 98.0 /100 | #110 | Exceptional 5.0% |
| Brazilians | 97.4 /100 | #111 | Exceptional 5.0% |
| Taiwanese | 97.3 /100 | #112 | Exceptional 5.0% |
| Immigrants | Pakistan | 97.2 /100 | #113 | Exceptional 5.0% |
| Immigrants | Morocco | 96.8 /100 | #114 | Exceptional 5.0% |
Demographics Similar to Shoshone by Professional Degree
In terms of professional degree, the demographic groups most similar to Shoshone are Pima (3.3%, a difference of 0.010%), Immigrants from Latin America (3.3%, a difference of 0.33%), Cherokee (3.3%, a difference of 0.48%), Samoan (3.3%, a difference of 0.50%), and Sioux (3.3%, a difference of 1.1%).
| Demographics | Rating | Rank | Professional Degree |
| Immigrants | Dominican Republic | 0.2 /100 | #301 | Tragic 3.4% |
| Malaysians | 0.2 /100 | #302 | Tragic 3.4% |
| Immigrants | Haiti | 0.2 /100 | #303 | Tragic 3.4% |
| Cajuns | 0.2 /100 | #304 | Tragic 3.4% |
| Chickasaw | 0.1 /100 | #305 | Tragic 3.4% |
| Cape Verdeans | 0.1 /100 | #306 | Tragic 3.4% |
| Samoans | 0.1 /100 | #307 | Tragic 3.3% |
| Shoshone | 0.1 /100 | #308 | Tragic 3.3% |
| Pima | 0.1 /100 | #309 | Tragic 3.3% |
| Immigrants | Latin America | 0.1 /100 | #310 | Tragic 3.3% |
| Cherokee | 0.1 /100 | #311 | Tragic 3.3% |
| Sioux | 0.1 /100 | #312 | Tragic 3.3% |
| Yuman | 0.1 /100 | #313 | Tragic 3.3% |
| Mexican American Indians | 0.1 /100 | #314 | Tragic 3.3% |
| Immigrants | Laos | 0.1 /100 | #315 | Tragic 3.2% |