Maltese vs Guyanese 3rd Grade
COMPARE
Maltese
Guyanese
3rd Grade
3rd Grade Comparison
Maltese
Guyanese
98.3%
3RD GRADE
99.7/ 100
METRIC RATING
59th/ 347
METRIC RANK
96.7%
3RD GRADE
0.0/ 100
METRIC RATING
306th/ 347
METRIC RANK
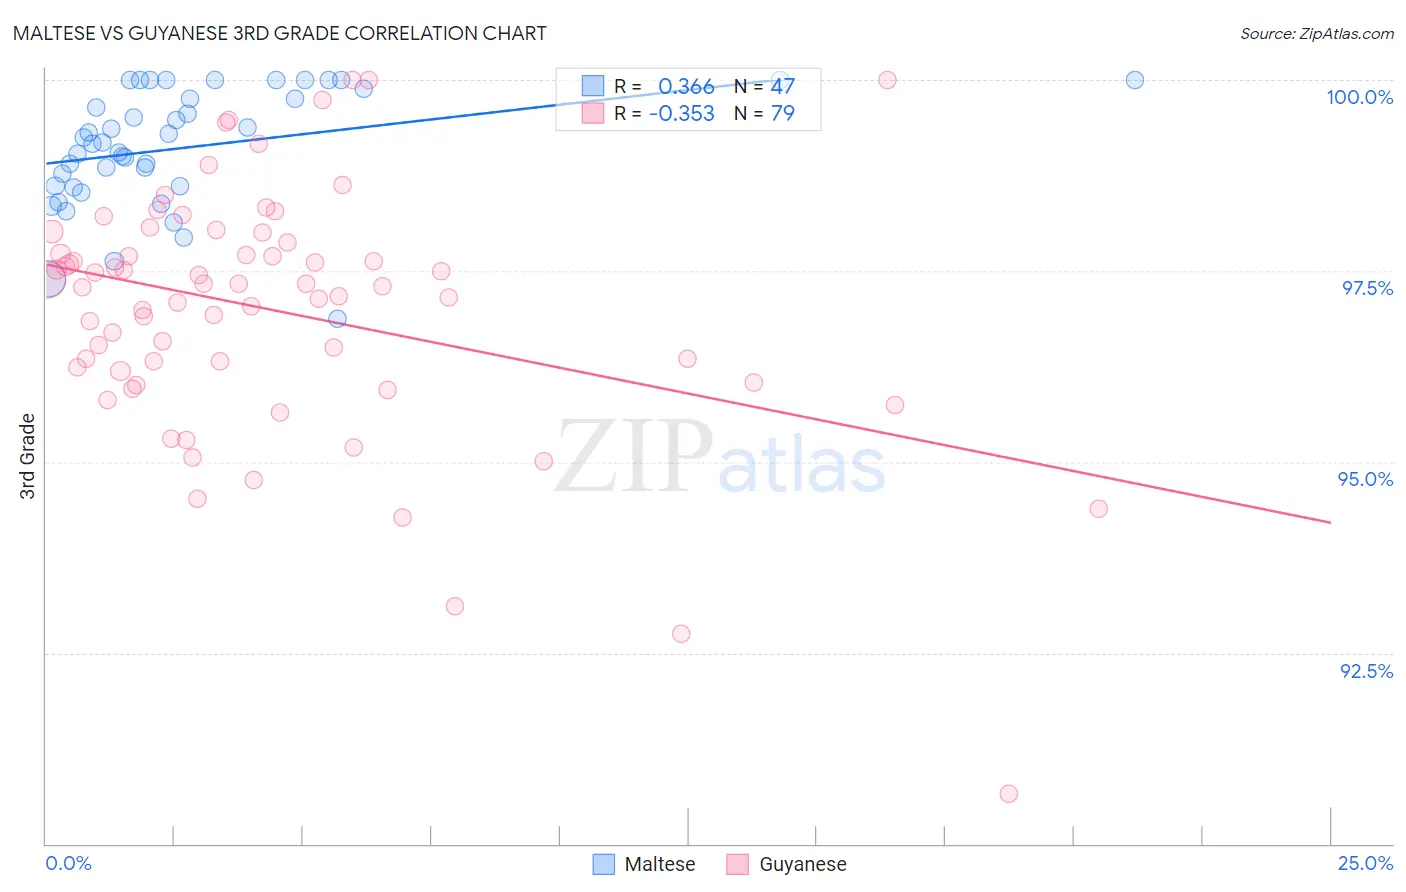
Maltese vs Guyanese 3rd Grade Correlation Chart
The statistical analysis conducted on geographies consisting of 126,476,608 people shows a mild positive correlation between the proportion of Maltese and percentage of population with at least 3rd grade education in the United States with a correlation coefficient (R) of 0.366 and weighted average of 98.3%. Similarly, the statistical analysis conducted on geographies consisting of 176,921,765 people shows a mild negative correlation between the proportion of Guyanese and percentage of population with at least 3rd grade education in the United States with a correlation coefficient (R) of -0.353 and weighted average of 96.7%, a difference of 1.6%.
3rd Grade Correlation Summary
| Measurement | Maltese | Guyanese |
| Minimum | 96.9% | 90.7% |
| Maximum | 100.0% | 100.0% |
| Range | 3.1% | 9.3% |
| Mean | 99.1% | 97.0% |
| Median | 99.2% | 97.3% |
| Interquartile 25% (IQ1) | 98.6% | 96.2% |
| Interquartile 75% (IQ3) | 99.9% | 97.9% |
| Interquartile Range (IQR) | 1.3% | 1.7% |
| Standard Deviation (Sample) | 0.77% | 1.6% |
| Standard Deviation (Population) | 0.76% | 1.6% |
Similar Demographics by 3rd Grade
Demographics Similar to Maltese by 3rd Grade
In terms of 3rd grade, the demographic groups most similar to Maltese are Slavic (98.3%, a difference of 0.0%), Greek (98.3%, a difference of 0.0%), Creek (98.2%, a difference of 0.0%), Bulgarian (98.3%, a difference of 0.010%), and American (98.3%, a difference of 0.010%).
| Demographics | Rating | Rank | 3rd Grade |
| Whites/Caucasians | 99.8 /100 | #52 | Exceptional 98.3% |
| Immigrants | Scotland | 99.8 /100 | #53 | Exceptional 98.3% |
| Bulgarians | 99.8 /100 | #54 | Exceptional 98.3% |
| Americans | 99.8 /100 | #55 | Exceptional 98.3% |
| Austrians | 99.8 /100 | #56 | Exceptional 98.3% |
| Slavs | 99.7 /100 | #57 | Exceptional 98.3% |
| Greeks | 99.7 /100 | #58 | Exceptional 98.3% |
| Maltese | 99.7 /100 | #59 | Exceptional 98.3% |
| Creek | 99.7 /100 | #60 | Exceptional 98.2% |
| Pueblo | 99.7 /100 | #61 | Exceptional 98.2% |
| Immigrants | Canada | 99.7 /100 | #62 | Exceptional 98.2% |
| Immigrants | North America | 99.7 /100 | #63 | Exceptional 98.2% |
| Kiowa | 99.6 /100 | #64 | Exceptional 98.2% |
| New Zealanders | 99.6 /100 | #65 | Exceptional 98.2% |
| Serbians | 99.6 /100 | #66 | Exceptional 98.2% |
Demographics Similar to Guyanese by 3rd Grade
In terms of 3rd grade, the demographic groups most similar to Guyanese are Nicaraguan (96.7%, a difference of 0.020%), Immigrants from Haiti (96.7%, a difference of 0.020%), Sri Lankan (96.7%, a difference of 0.020%), Central American Indian (96.7%, a difference of 0.030%), and Immigrants from Caribbean (96.7%, a difference of 0.040%).
| Demographics | Rating | Rank | 3rd Grade |
| Somalis | 0.0 /100 | #299 | Tragic 96.8% |
| Immigrants | South Eastern Asia | 0.0 /100 | #300 | Tragic 96.8% |
| Immigrants | Cuba | 0.0 /100 | #301 | Tragic 96.8% |
| Immigrants | Somalia | 0.0 /100 | #302 | Tragic 96.8% |
| Ecuadorians | 0.0 /100 | #303 | Tragic 96.7% |
| Immigrants | Caribbean | 0.0 /100 | #304 | Tragic 96.7% |
| Central American Indians | 0.0 /100 | #305 | Tragic 96.7% |
| Guyanese | 0.0 /100 | #306 | Tragic 96.7% |
| Nicaraguans | 0.0 /100 | #307 | Tragic 96.7% |
| Immigrants | Haiti | 0.0 /100 | #308 | Tragic 96.7% |
| Sri Lankans | 0.0 /100 | #309 | Tragic 96.7% |
| Cape Verdeans | 0.0 /100 | #310 | Tragic 96.6% |
| Immigrants | Guyana | 0.0 /100 | #311 | Tragic 96.6% |
| Immigrants | Laos | 0.0 /100 | #312 | Tragic 96.6% |
| Immigrants | Ecuador | 0.0 /100 | #313 | Tragic 96.6% |