Malaysian vs Finnish 9th Grade
COMPARE
Malaysian
Finnish
9th Grade
9th Grade Comparison
Malaysians
Finns
93.5%
9TH GRADE
0.0/ 100
METRIC RATING
282nd/ 347
METRIC RANK
96.6%
9TH GRADE
100.0/ 100
METRIC RATING
11th/ 347
METRIC RANK
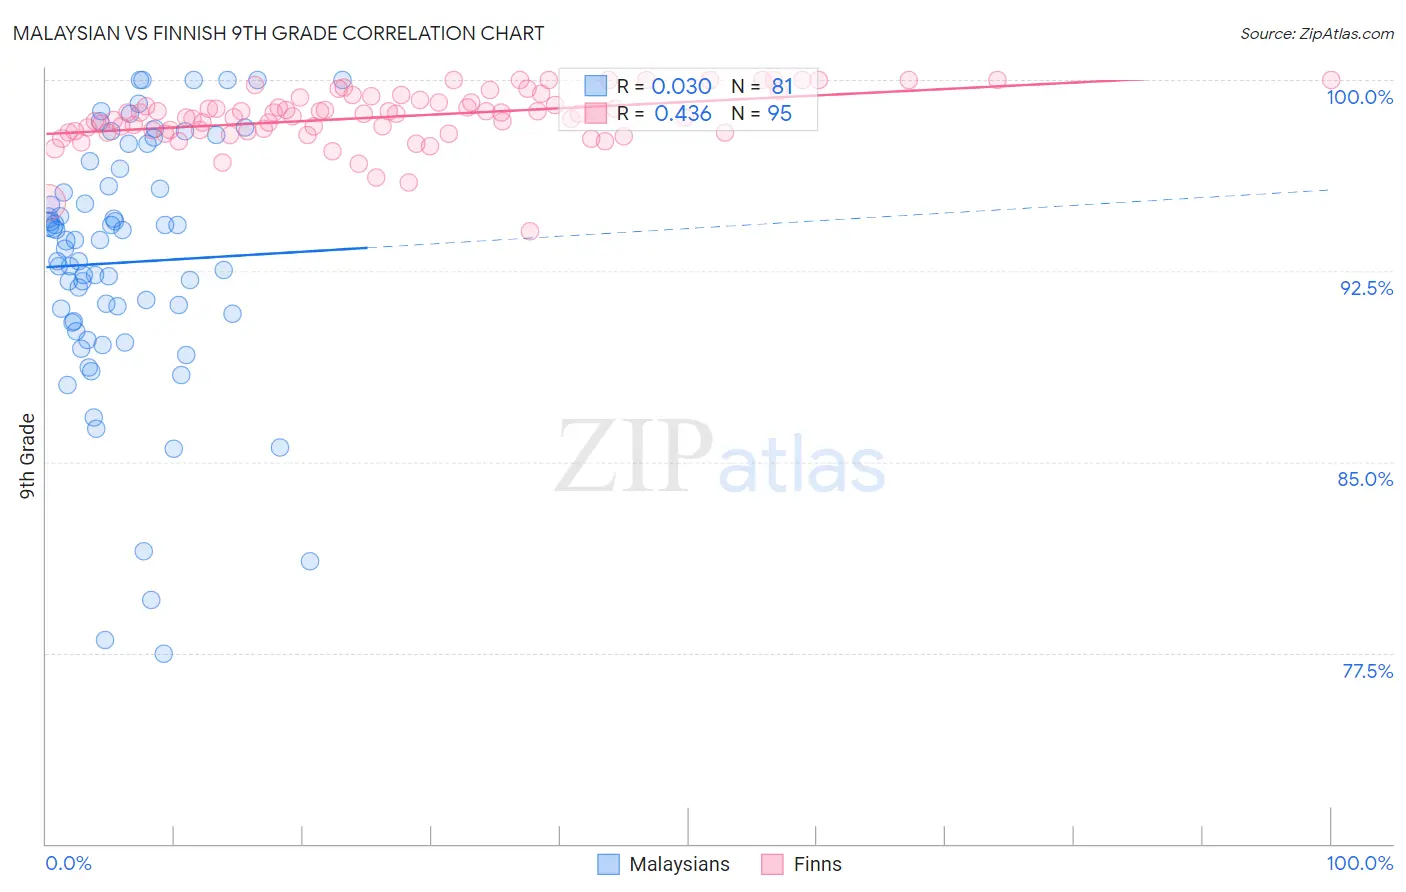
Malaysian vs Finnish 9th Grade Correlation Chart
The statistical analysis conducted on geographies consisting of 226,107,000 people shows no correlation between the proportion of Malaysians and percentage of population with at least 9th grade education in the United States with a correlation coefficient (R) of 0.030 and weighted average of 93.5%. Similarly, the statistical analysis conducted on geographies consisting of 404,676,377 people shows a moderate positive correlation between the proportion of Finns and percentage of population with at least 9th grade education in the United States with a correlation coefficient (R) of 0.436 and weighted average of 96.6%, a difference of 3.3%.
9th Grade Correlation Summary
| Measurement | Malaysian | Finnish |
| Minimum | 77.5% | 94.1% |
| Maximum | 100.0% | 100.0% |
| Range | 22.5% | 5.9% |
| Mean | 92.8% | 98.5% |
| Median | 93.7% | 98.7% |
| Interquartile 25% (IQ1) | 90.5% | 98.0% |
| Interquartile 75% (IQ3) | 96.2% | 99.3% |
| Interquartile Range (IQR) | 5.7% | 1.3% |
| Standard Deviation (Sample) | 5.0% | 1.1% |
| Standard Deviation (Population) | 5.0% | 1.1% |
Similar Demographics by 9th Grade
Demographics Similar to Malaysians by 9th Grade
In terms of 9th grade, the demographic groups most similar to Malaysians are Barbadian (93.5%, a difference of 0.020%), Immigrants from Trinidad and Tobago (93.6%, a difference of 0.050%), Bangladeshi (93.4%, a difference of 0.080%), Taiwanese (93.6%, a difference of 0.090%), and Immigrants from Peru (93.4%, a difference of 0.13%).
| Demographics | Rating | Rank | 9th Grade |
| Immigrants | Colombia | 0.2 /100 | #275 | Tragic 93.8% |
| West Indians | 0.2 /100 | #276 | Tragic 93.7% |
| Immigrants | Philippines | 0.1 /100 | #277 | Tragic 93.7% |
| Immigrants | Eritrea | 0.1 /100 | #278 | Tragic 93.7% |
| Trinidadians and Tobagonians | 0.1 /100 | #279 | Tragic 93.7% |
| Taiwanese | 0.1 /100 | #280 | Tragic 93.6% |
| Immigrants | Trinidad and Tobago | 0.1 /100 | #281 | Tragic 93.6% |
| Malaysians | 0.0 /100 | #282 | Tragic 93.5% |
| Barbadians | 0.0 /100 | #283 | Tragic 93.5% |
| Bangladeshis | 0.0 /100 | #284 | Tragic 93.4% |
| Immigrants | Peru | 0.0 /100 | #285 | Tragic 93.4% |
| Immigrants | Barbados | 0.0 /100 | #286 | Tragic 93.4% |
| Immigrants | St. Vincent and the Grenadines | 0.0 /100 | #287 | Tragic 93.4% |
| Immigrants | South Eastern Asia | 0.0 /100 | #288 | Tragic 93.3% |
| Immigrants | West Indies | 0.0 /100 | #289 | Tragic 93.3% |
Demographics Similar to Finns by 9th Grade
In terms of 9th grade, the demographic groups most similar to Finns are Lithuanian (96.6%, a difference of 0.0%), English (96.6%, a difference of 0.020%), Tlingit-Haida (96.6%, a difference of 0.040%), Danish (96.5%, a difference of 0.070%), and Scottish (96.5%, a difference of 0.070%).
| Demographics | Rating | Rank | 9th Grade |
| Slovenes | 100.0 /100 | #4 | Exceptional 96.7% |
| Swedes | 100.0 /100 | #5 | Exceptional 96.7% |
| Poles | 100.0 /100 | #6 | Exceptional 96.7% |
| Carpatho Rusyns | 100.0 /100 | #7 | Exceptional 96.7% |
| Germans | 100.0 /100 | #8 | Exceptional 96.7% |
| Tlingit-Haida | 100.0 /100 | #9 | Exceptional 96.6% |
| Lithuanians | 100.0 /100 | #10 | Exceptional 96.6% |
| Finns | 100.0 /100 | #11 | Exceptional 96.6% |
| English | 100.0 /100 | #12 | Exceptional 96.6% |
| Danes | 100.0 /100 | #13 | Exceptional 96.5% |
| Scottish | 100.0 /100 | #14 | Exceptional 96.5% |
| Irish | 100.0 /100 | #15 | Exceptional 96.5% |
| Croatians | 100.0 /100 | #16 | Exceptional 96.5% |
| Dutch | 100.0 /100 | #17 | Exceptional 96.5% |
| Scandinavians | 100.0 /100 | #18 | Exceptional 96.5% |