Malaysian vs Brazilian 7th Grade
COMPARE
Malaysian
Brazilian
7th Grade
7th Grade Comparison
Malaysians
Brazilians
94.8%
7TH GRADE
0.0/ 100
METRIC RATING
290th/ 347
METRIC RANK
96.0%
7TH GRADE
37.3/ 100
METRIC RATING
185th/ 347
METRIC RANK
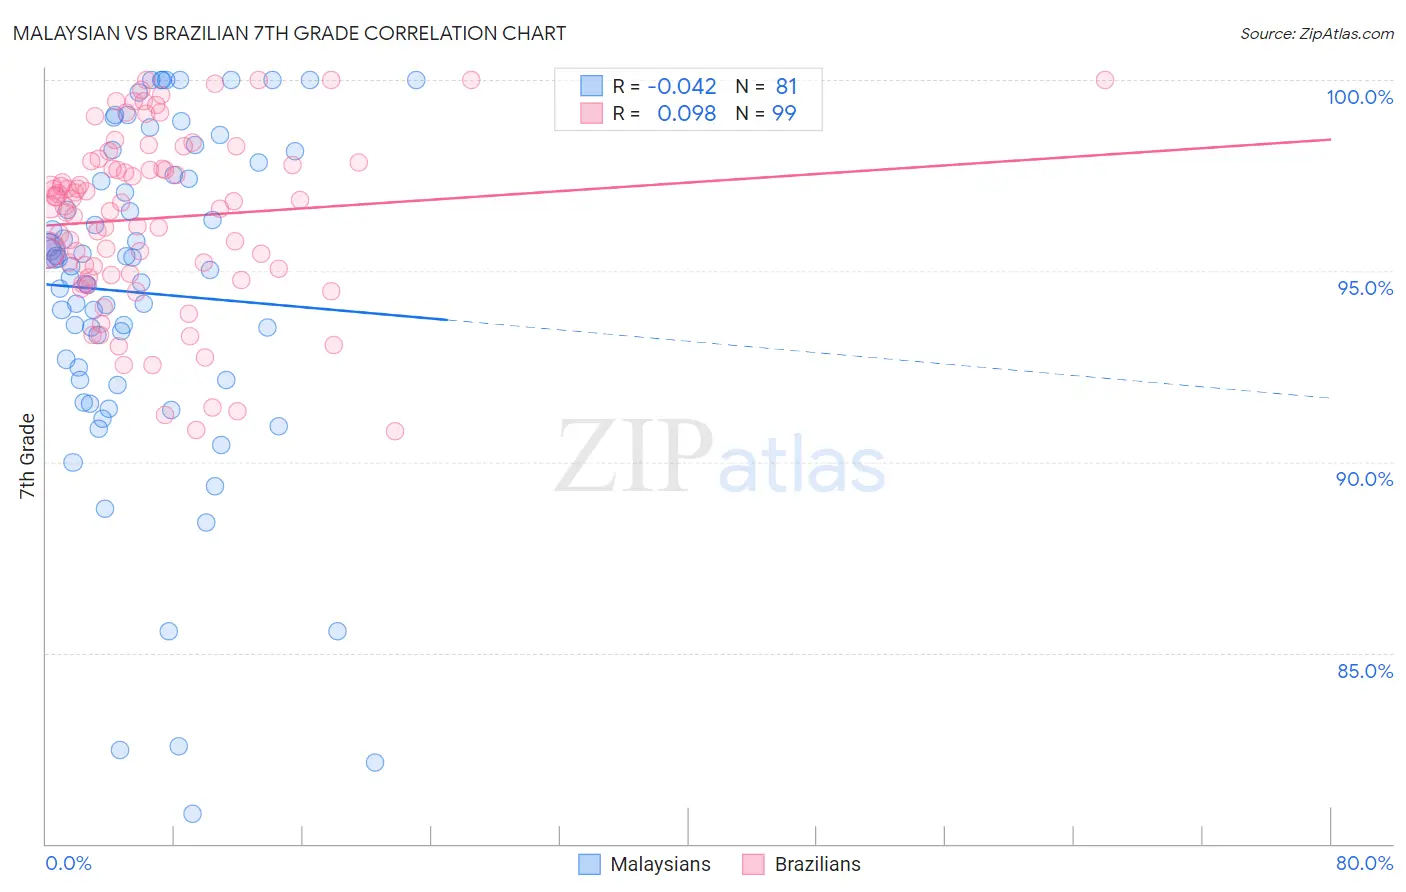
Malaysian vs Brazilian 7th Grade Correlation Chart
The statistical analysis conducted on geographies consisting of 226,107,000 people shows no correlation between the proportion of Malaysians and percentage of population with at least 7th grade education in the United States with a correlation coefficient (R) of -0.042 and weighted average of 94.8%. Similarly, the statistical analysis conducted on geographies consisting of 323,962,626 people shows a slight positive correlation between the proportion of Brazilians and percentage of population with at least 7th grade education in the United States with a correlation coefficient (R) of 0.098 and weighted average of 96.0%, a difference of 1.2%.
7th Grade Correlation Summary
| Measurement | Malaysian | Brazilian |
| Minimum | 80.8% | 90.8% |
| Maximum | 100.0% | 100.0% |
| Range | 19.2% | 9.2% |
| Mean | 94.4% | 96.4% |
| Median | 95.1% | 96.8% |
| Interquartile 25% (IQ1) | 92.1% | 94.9% |
| Interquartile 75% (IQ3) | 97.7% | 97.8% |
| Interquartile Range (IQR) | 5.5% | 2.9% |
| Standard Deviation (Sample) | 4.4% | 2.3% |
| Standard Deviation (Population) | 4.4% | 2.3% |
Similar Demographics by 7th Grade
Demographics Similar to Malaysians by 7th Grade
In terms of 7th grade, the demographic groups most similar to Malaysians are Taiwanese (94.8%, a difference of 0.020%), British West Indian (94.8%, a difference of 0.030%), Immigrants from Grenada (94.8%, a difference of 0.040%), Immigrants from Peru (94.9%, a difference of 0.050%), and Immigrants from Philippines (94.9%, a difference of 0.060%).
| Demographics | Rating | Rank | 7th Grade |
| Immigrants | Barbados | 0.1 /100 | #283 | Tragic 95.0% |
| Armenians | 0.1 /100 | #284 | Tragic 95.0% |
| Immigrants | Eritrea | 0.1 /100 | #285 | Tragic 94.9% |
| Immigrants | Philippines | 0.0 /100 | #286 | Tragic 94.9% |
| Immigrants | Peru | 0.0 /100 | #287 | Tragic 94.9% |
| British West Indians | 0.0 /100 | #288 | Tragic 94.8% |
| Taiwanese | 0.0 /100 | #289 | Tragic 94.8% |
| Malaysians | 0.0 /100 | #290 | Tragic 94.8% |
| Immigrants | Grenada | 0.0 /100 | #291 | Tragic 94.8% |
| Immigrants | West Indies | 0.0 /100 | #292 | Tragic 94.8% |
| Fijians | 0.0 /100 | #293 | Tragic 94.7% |
| Haitians | 0.0 /100 | #294 | Tragic 94.7% |
| Yaqui | 0.0 /100 | #295 | Tragic 94.6% |
| Cubans | 0.0 /100 | #296 | Tragic 94.6% |
| Immigrants | South Eastern Asia | 0.0 /100 | #297 | Tragic 94.5% |
Demographics Similar to Brazilians by 7th Grade
In terms of 7th grade, the demographic groups most similar to Brazilians are Sierra Leonean (96.0%, a difference of 0.0%), Immigrants from Spain (96.0%, a difference of 0.010%), Immigrants from Iraq (96.0%, a difference of 0.010%), Immigrants from Uganda (96.0%, a difference of 0.010%), and Immigrants from Egypt (95.9%, a difference of 0.020%).
| Demographics | Rating | Rank | 7th Grade |
| Marshallese | 48.4 /100 | #178 | Average 96.0% |
| Immigrants | Iran | 47.8 /100 | #179 | Average 96.0% |
| Immigrants | Brazil | 46.8 /100 | #180 | Average 96.0% |
| Pakistanis | 44.5 /100 | #181 | Average 96.0% |
| Iraqis | 41.2 /100 | #182 | Average 96.0% |
| Immigrants | Spain | 38.8 /100 | #183 | Fair 96.0% |
| Sierra Leoneans | 37.5 /100 | #184 | Fair 96.0% |
| Brazilians | 37.3 /100 | #185 | Fair 96.0% |
| Immigrants | Iraq | 36.1 /100 | #186 | Fair 96.0% |
| Immigrants | Uganda | 36.0 /100 | #187 | Fair 96.0% |
| Immigrants | Egypt | 34.3 /100 | #188 | Fair 95.9% |
| Immigrants | Venezuela | 33.9 /100 | #189 | Fair 95.9% |
| Immigrants | Micronesia | 32.6 /100 | #190 | Fair 95.9% |
| Liberians | 32.5 /100 | #191 | Fair 95.9% |
| Panamanians | 32.3 /100 | #192 | Fair 95.9% |