Macedonian vs Salvadoran College, 1 year or more
COMPARE
Macedonian
Salvadoran
College, 1 year or more
College, 1 year or more Comparison
Macedonians
Salvadorans
61.8%
COLLEGE, 1 YEAR OR MORE
95.6/ 100
METRIC RATING
111th/ 347
METRIC RANK
51.8%
COLLEGE, 1 YEAR OR MORE
0.0/ 100
METRIC RATING
308th/ 347
METRIC RANK
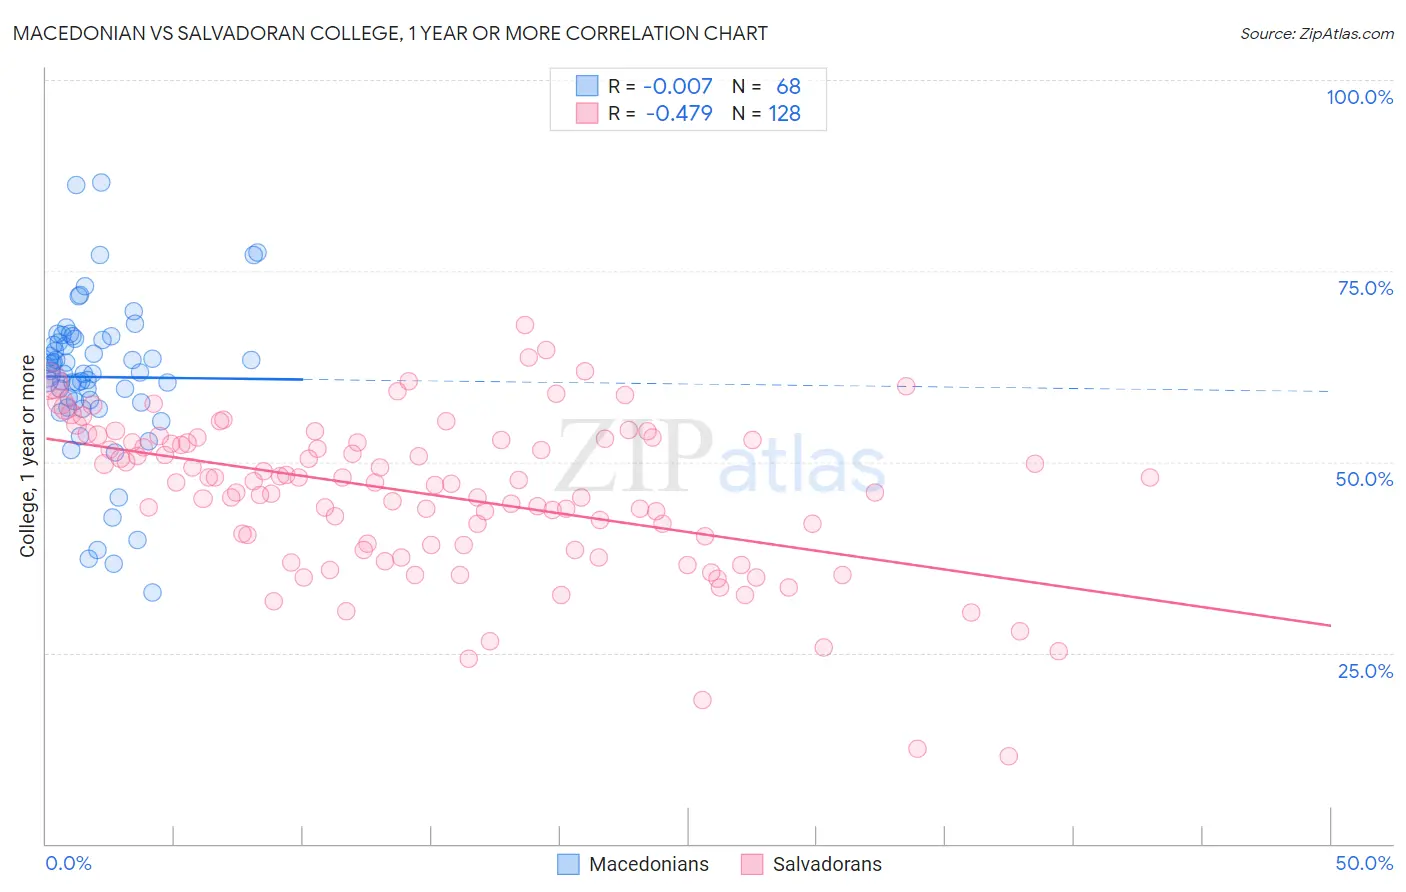
Macedonian vs Salvadoran College, 1 year or more Correlation Chart
The statistical analysis conducted on geographies consisting of 132,646,607 people shows no correlation between the proportion of Macedonians and percentage of population with at least college, 1 year or more education in the United States with a correlation coefficient (R) of -0.007 and weighted average of 61.8%. Similarly, the statistical analysis conducted on geographies consisting of 399,066,110 people shows a moderate negative correlation between the proportion of Salvadorans and percentage of population with at least college, 1 year or more education in the United States with a correlation coefficient (R) of -0.479 and weighted average of 51.8%, a difference of 19.4%.
College, 1 year or more Correlation Summary
| Measurement | Macedonian | Salvadoran |
| Minimum | 33.0% | 11.5% |
| Maximum | 86.6% | 67.9% |
| Range | 53.6% | 56.4% |
| Mean | 61.1% | 45.7% |
| Median | 61.7% | 47.3% |
| Interquartile 25% (IQ1) | 57.9% | 39.1% |
| Interquartile 75% (IQ3) | 66.0% | 52.9% |
| Interquartile Range (IQR) | 8.1% | 13.8% |
| Standard Deviation (Sample) | 10.1% | 10.3% |
| Standard Deviation (Population) | 10.1% | 10.2% |
Similar Demographics by College, 1 year or more
Demographics Similar to Macedonians by College, 1 year or more
In terms of college, 1 year or more, the demographic groups most similar to Macedonians are European (61.8%, a difference of 0.0%), Syrian (61.9%, a difference of 0.020%), Immigrants from Northern Africa (61.9%, a difference of 0.020%), Immigrants from Ukraine (61.9%, a difference of 0.040%), and Austrian (61.8%, a difference of 0.060%).
| Demographics | Rating | Rank | College, 1 year or more |
| Chileans | 96.4 /100 | #104 | Exceptional 62.0% |
| Immigrants | Nepal | 96.3 /100 | #105 | Exceptional 62.0% |
| Palestinians | 96.3 /100 | #106 | Exceptional 62.0% |
| Immigrants | Ukraine | 95.8 /100 | #107 | Exceptional 61.9% |
| Syrians | 95.7 /100 | #108 | Exceptional 61.9% |
| Immigrants | Northern Africa | 95.7 /100 | #109 | Exceptional 61.9% |
| Europeans | 95.6 /100 | #110 | Exceptional 61.8% |
| Macedonians | 95.6 /100 | #111 | Exceptional 61.8% |
| Austrians | 95.4 /100 | #112 | Exceptional 61.8% |
| Ukrainians | 95.2 /100 | #113 | Exceptional 61.8% |
| Danes | 94.8 /100 | #114 | Exceptional 61.7% |
| Norwegians | 94.5 /100 | #115 | Exceptional 61.7% |
| Lebanese | 94.1 /100 | #116 | Exceptional 61.6% |
| Arabs | 93.9 /100 | #117 | Exceptional 61.6% |
| Immigrants | Brazil | 93.9 /100 | #118 | Exceptional 61.6% |
Demographics Similar to Salvadorans by College, 1 year or more
In terms of college, 1 year or more, the demographic groups most similar to Salvadorans are Apache (51.8%, a difference of 0.010%), Immigrants from Portugal (51.9%, a difference of 0.10%), Mexican American Indian (51.9%, a difference of 0.20%), Honduran (51.6%, a difference of 0.40%), and Seminole (52.1%, a difference of 0.54%).
| Demographics | Rating | Rank | College, 1 year or more |
| Haitians | 0.0 /100 | #301 | Tragic 52.3% |
| Puerto Ricans | 0.0 /100 | #302 | Tragic 52.2% |
| Creek | 0.0 /100 | #303 | Tragic 52.2% |
| Central Americans | 0.0 /100 | #304 | Tragic 52.1% |
| Seminole | 0.0 /100 | #305 | Tragic 52.1% |
| Mexican American Indians | 0.0 /100 | #306 | Tragic 51.9% |
| Immigrants | Portugal | 0.0 /100 | #307 | Tragic 51.9% |
| Salvadorans | 0.0 /100 | #308 | Tragic 51.8% |
| Apache | 0.0 /100 | #309 | Tragic 51.8% |
| Hondurans | 0.0 /100 | #310 | Tragic 51.6% |
| Immigrants | Haiti | 0.0 /100 | #311 | Tragic 51.5% |
| Pueblo | 0.0 /100 | #312 | Tragic 51.5% |
| Immigrants | Caribbean | 0.0 /100 | #313 | Tragic 51.4% |
| Fijians | 0.0 /100 | #314 | Tragic 51.3% |
| Guatemalans | 0.0 /100 | #315 | Tragic 51.2% |