Macedonian vs Bahamian 4th Grade
COMPARE
Macedonian
Bahamian
4th Grade
4th Grade Comparison
Macedonians
Bahamians
98.0%
4TH GRADE
99.4/ 100
METRIC RATING
73rd/ 347
METRIC RANK
97.2%
4TH GRADE
3.8/ 100
METRIC RATING
226th/ 347
METRIC RANK
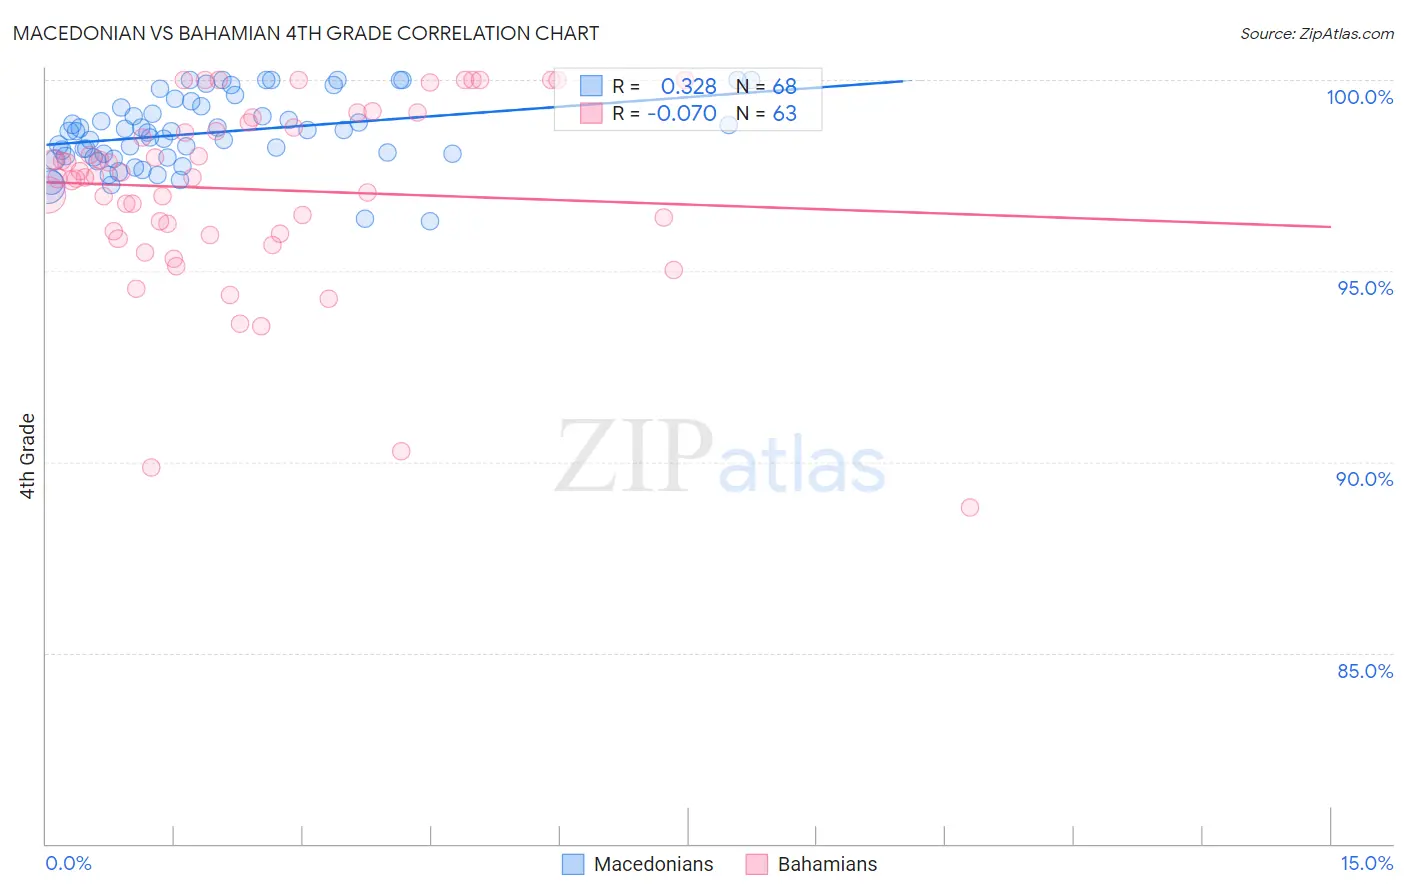
Macedonian vs Bahamian 4th Grade Correlation Chart
The statistical analysis conducted on geographies consisting of 132,592,860 people shows a mild positive correlation between the proportion of Macedonians and percentage of population with at least 4th grade education in the United States with a correlation coefficient (R) of 0.328 and weighted average of 98.0%. Similarly, the statistical analysis conducted on geographies consisting of 112,698,819 people shows a slight negative correlation between the proportion of Bahamians and percentage of population with at least 4th grade education in the United States with a correlation coefficient (R) of -0.070 and weighted average of 97.2%, a difference of 0.79%.
4th Grade Correlation Summary
| Measurement | Macedonian | Bahamian |
| Minimum | 96.3% | 88.8% |
| Maximum | 100.0% | 100.0% |
| Range | 3.7% | 11.2% |
| Mean | 98.6% | 97.1% |
| Median | 98.7% | 97.4% |
| Interquartile 25% (IQ1) | 98.0% | 96.0% |
| Interquartile 75% (IQ3) | 99.3% | 98.9% |
| Interquartile Range (IQR) | 1.3% | 2.9% |
| Standard Deviation (Sample) | 0.91% | 2.4% |
| Standard Deviation (Population) | 0.91% | 2.4% |
Similar Demographics by 4th Grade
Demographics Similar to Macedonians by 4th Grade
In terms of 4th grade, the demographic groups most similar to Macedonians are Iranian (98.0%, a difference of 0.0%), Chickasaw (98.0%, a difference of 0.0%), Immigrants from Netherlands (98.0%, a difference of 0.020%), Cherokee (98.0%, a difference of 0.020%), and Immigrants from Lithuania (98.0%, a difference of 0.020%).
| Demographics | Rating | Rank | 4th Grade |
| Canadians | 99.6 /100 | #66 | Exceptional 98.0% |
| New Zealanders | 99.6 /100 | #67 | Exceptional 98.0% |
| Kiowa | 99.6 /100 | #68 | Exceptional 98.0% |
| Pueblo | 99.6 /100 | #69 | Exceptional 98.0% |
| Immigrants | Austria | 99.6 /100 | #70 | Exceptional 98.0% |
| Lumbee | 99.6 /100 | #71 | Exceptional 98.0% |
| Iranians | 99.4 /100 | #72 | Exceptional 98.0% |
| Macedonians | 99.4 /100 | #73 | Exceptional 98.0% |
| Chickasaw | 99.4 /100 | #74 | Exceptional 98.0% |
| Immigrants | Netherlands | 99.3 /100 | #75 | Exceptional 98.0% |
| Cherokee | 99.3 /100 | #76 | Exceptional 98.0% |
| Immigrants | Lithuania | 99.3 /100 | #77 | Exceptional 98.0% |
| Immigrants | England | 99.3 /100 | #78 | Exceptional 98.0% |
| Ukrainians | 99.2 /100 | #79 | Exceptional 98.0% |
| Osage | 99.2 /100 | #80 | Exceptional 98.0% |
Demographics Similar to Bahamians by 4th Grade
In terms of 4th grade, the demographic groups most similar to Bahamians are Immigrants from Pakistan (97.2%, a difference of 0.0%), Subsaharan African (97.2%, a difference of 0.010%), Liberian (97.2%, a difference of 0.010%), Uruguayan (97.2%, a difference of 0.010%), and Immigrants from Malaysia (97.2%, a difference of 0.010%).
| Demographics | Rating | Rank | 4th Grade |
| Tongans | 5.8 /100 | #219 | Tragic 97.3% |
| South American Indians | 5.5 /100 | #220 | Tragic 97.3% |
| Immigrants | Panama | 5.4 /100 | #221 | Tragic 97.3% |
| Immigrants | Lebanon | 5.1 /100 | #222 | Tragic 97.3% |
| Immigrants | Sudan | 5.0 /100 | #223 | Tragic 97.2% |
| Immigrants | Syria | 5.0 /100 | #224 | Tragic 97.2% |
| Immigrants | Iraq | 4.6 /100 | #225 | Tragic 97.2% |
| Bahamians | 3.8 /100 | #226 | Tragic 97.2% |
| Immigrants | Pakistan | 3.7 /100 | #227 | Tragic 97.2% |
| Sub-Saharan Africans | 3.6 /100 | #228 | Tragic 97.2% |
| Liberians | 3.6 /100 | #229 | Tragic 97.2% |
| Uruguayans | 3.5 /100 | #230 | Tragic 97.2% |
| Immigrants | Malaysia | 3.4 /100 | #231 | Tragic 97.2% |
| Immigrants | Western Asia | 3.4 /100 | #232 | Tragic 97.2% |
| Senegalese | 3.1 /100 | #233 | Tragic 97.2% |