Luxembourger vs Arab 4th Grade
COMPARE
Luxembourger
Arab
4th Grade
4th Grade Comparison
Luxembourgers
Arabs
98.2%
4TH GRADE
99.9/ 100
METRIC RATING
40th/ 347
METRIC RANK
97.5%
4TH GRADE
48.7/ 100
METRIC RATING
176th/ 347
METRIC RANK
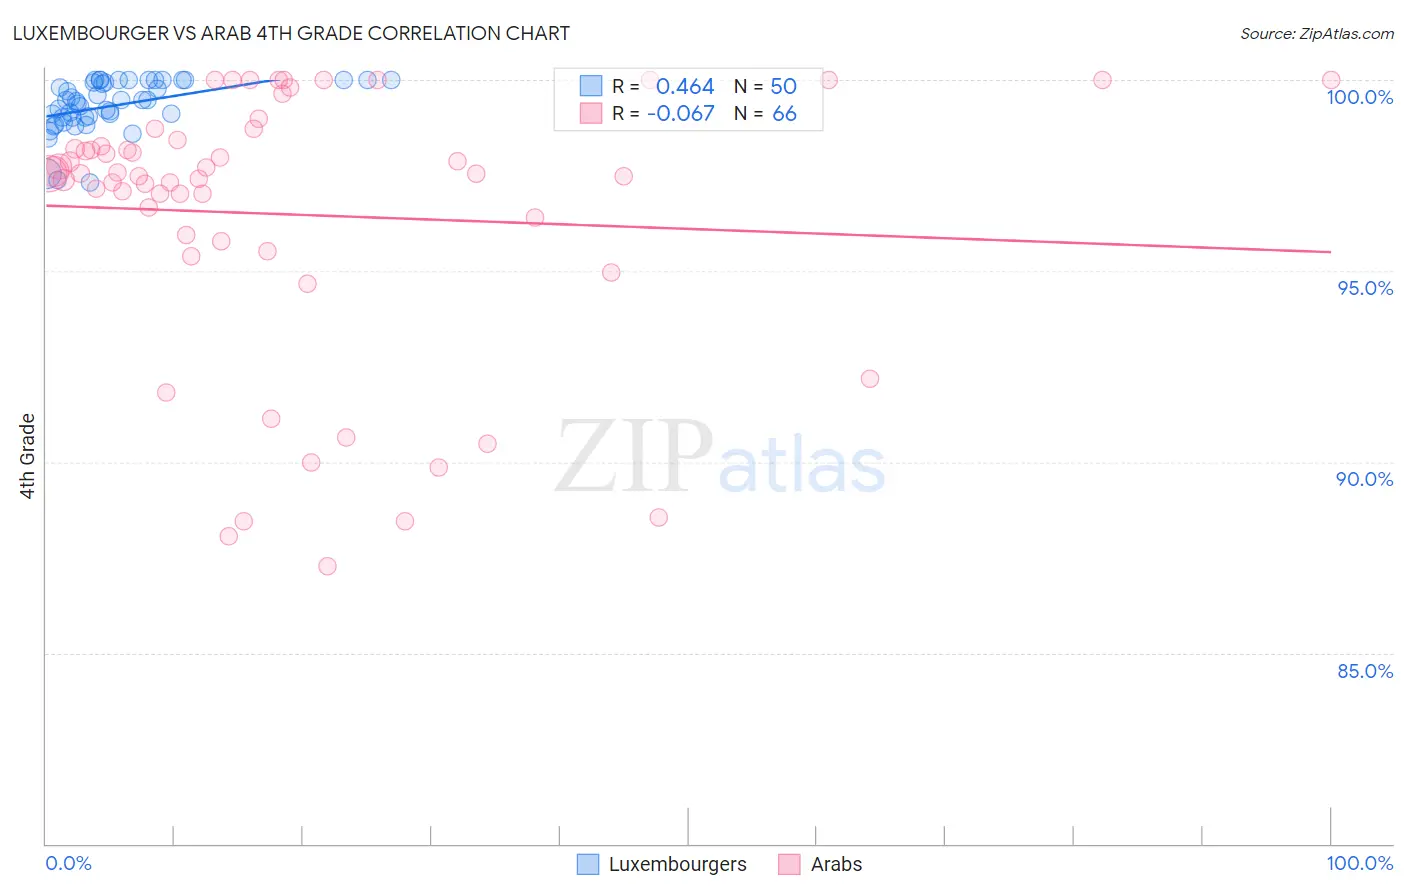
Luxembourger vs Arab 4th Grade Correlation Chart
The statistical analysis conducted on geographies consisting of 144,675,126 people shows a moderate positive correlation between the proportion of Luxembourgers and percentage of population with at least 4th grade education in the United States with a correlation coefficient (R) of 0.464 and weighted average of 98.2%. Similarly, the statistical analysis conducted on geographies consisting of 486,872,222 people shows a slight negative correlation between the proportion of Arabs and percentage of population with at least 4th grade education in the United States with a correlation coefficient (R) of -0.067 and weighted average of 97.5%, a difference of 0.69%.
4th Grade Correlation Summary
| Measurement | Luxembourger | Arab |
| Minimum | 97.3% | 87.3% |
| Maximum | 100.0% | 100.0% |
| Range | 2.7% | 12.7% |
| Mean | 99.3% | 96.5% |
| Median | 99.4% | 97.5% |
| Interquartile 25% (IQ1) | 99.0% | 95.8% |
| Interquartile 75% (IQ3) | 100.0% | 98.4% |
| Interquartile Range (IQR) | 0.99% | 2.7% |
| Standard Deviation (Sample) | 0.67% | 3.5% |
| Standard Deviation (Population) | 0.67% | 3.5% |
Similar Demographics by 4th Grade
Demographics Similar to Luxembourgers by 4th Grade
In terms of 4th grade, the demographic groups most similar to Luxembourgers are Belgian (98.2%, a difference of 0.0%), Eastern European (98.2%, a difference of 0.0%), Latvian (98.2%, a difference of 0.010%), Aleut (98.2%, a difference of 0.010%), and British (98.2%, a difference of 0.030%).
| Demographics | Rating | Rank | 4th Grade |
| Swiss | 100.0 /100 | #33 | Exceptional 98.2% |
| Chippewa | 100.0 /100 | #34 | Exceptional 98.2% |
| Italians | 100.0 /100 | #35 | Exceptional 98.2% |
| British | 100.0 /100 | #36 | Exceptional 98.2% |
| Latvians | 99.9 /100 | #37 | Exceptional 98.2% |
| Aleuts | 99.9 /100 | #38 | Exceptional 98.2% |
| Belgians | 99.9 /100 | #39 | Exceptional 98.2% |
| Luxembourgers | 99.9 /100 | #40 | Exceptional 98.2% |
| Eastern Europeans | 99.9 /100 | #41 | Exceptional 98.2% |
| Hungarians | 99.9 /100 | #42 | Exceptional 98.2% |
| Northern Europeans | 99.9 /100 | #43 | Exceptional 98.2% |
| Native Hawaiians | 99.9 /100 | #44 | Exceptional 98.1% |
| Czechoslovakians | 99.9 /100 | #45 | Exceptional 98.1% |
| Ottawa | 99.9 /100 | #46 | Exceptional 98.1% |
| Arapaho | 99.9 /100 | #47 | Exceptional 98.1% |
Demographics Similar to Arabs by 4th Grade
In terms of 4th grade, the demographic groups most similar to Arabs are Egyptian (97.5%, a difference of 0.0%), Immigrants from Micronesia (97.5%, a difference of 0.0%), Immigrants from Spain (97.5%, a difference of 0.010%), Brazilian (97.5%, a difference of 0.010%), and Immigrants from Sri Lanka (97.5%, a difference of 0.010%).
| Demographics | Rating | Rank | 4th Grade |
| Chileans | 54.4 /100 | #169 | Average 97.5% |
| Immigrants | Spain | 51.8 /100 | #170 | Average 97.5% |
| Brazilians | 51.5 /100 | #171 | Average 97.5% |
| Immigrants | Sri Lanka | 51.1 /100 | #172 | Average 97.5% |
| Immigrants | Korea | 50.6 /100 | #173 | Average 97.5% |
| Egyptians | 50.0 /100 | #174 | Average 97.5% |
| Immigrants | Micronesia | 49.6 /100 | #175 | Average 97.5% |
| Arabs | 48.7 /100 | #176 | Average 97.5% |
| Immigrants | Brazil | 46.1 /100 | #177 | Average 97.5% |
| Comanche | 45.3 /100 | #178 | Average 97.5% |
| Immigrants | Kazakhstan | 43.6 /100 | #179 | Average 97.5% |
| Immigrants | Venezuela | 42.7 /100 | #180 | Average 97.5% |
| Immigrants | Taiwan | 41.5 /100 | #181 | Average 97.5% |
| Spanish Americans | 39.3 /100 | #182 | Fair 97.5% |
| Argentineans | 39.0 /100 | #183 | Fair 97.5% |