Lebanese vs Immigrants from Uruguay 7th Grade
COMPARE
Lebanese
Immigrants from Uruguay
7th Grade
7th Grade Comparison
Lebanese
Immigrants from Uruguay
96.7%
7TH GRADE
98.8/ 100
METRIC RATING
94th/ 347
METRIC RANK
95.2%
7TH GRADE
0.3/ 100
METRIC RATING
265th/ 347
METRIC RANK
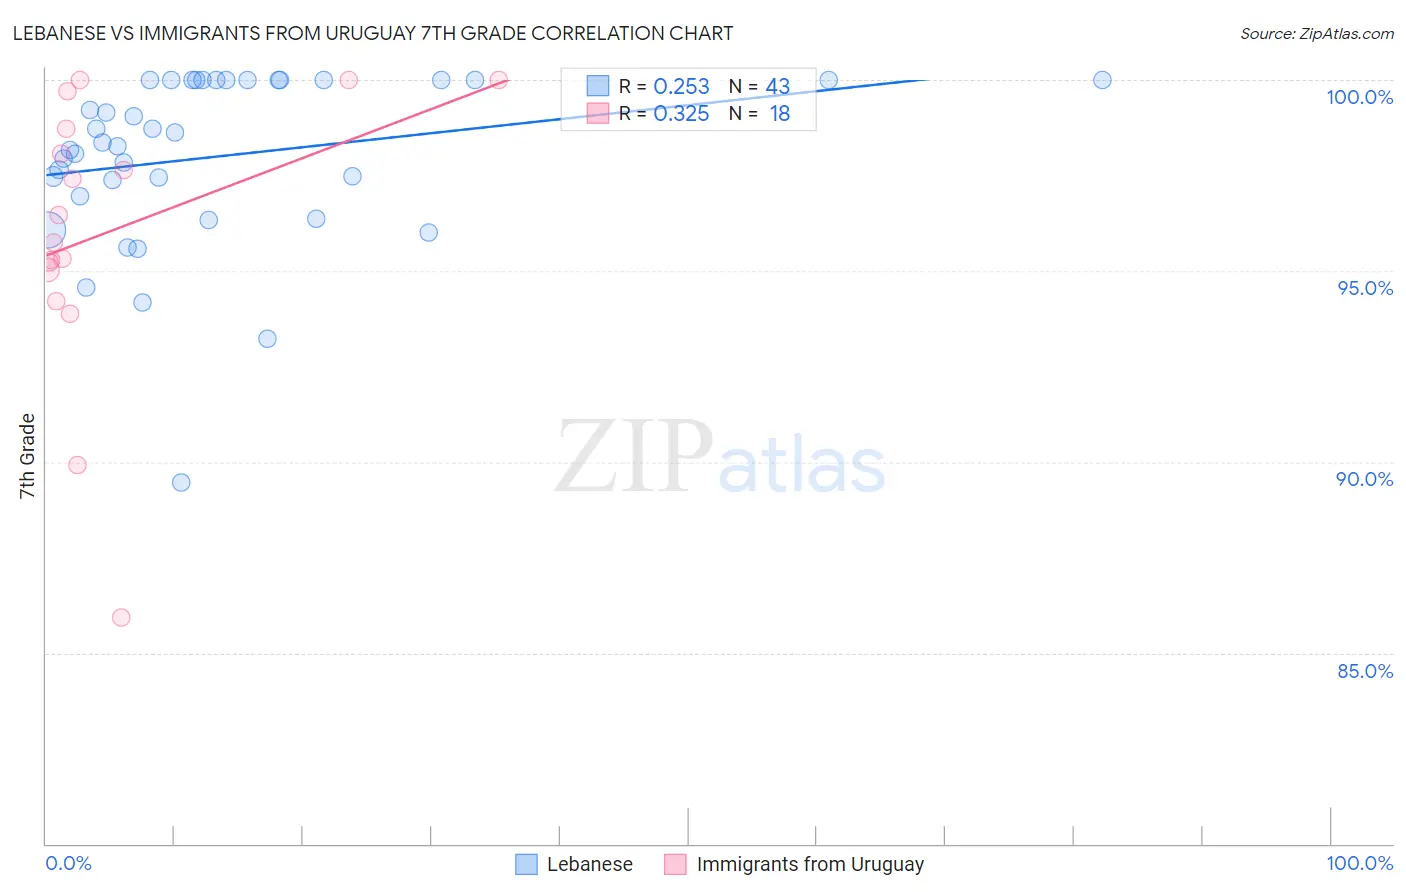
Lebanese vs Immigrants from Uruguay 7th Grade Correlation Chart
The statistical analysis conducted on geographies consisting of 401,571,113 people shows a weak positive correlation between the proportion of Lebanese and percentage of population with at least 7th grade education in the United States with a correlation coefficient (R) of 0.253 and weighted average of 96.7%. Similarly, the statistical analysis conducted on geographies consisting of 133,259,667 people shows a mild positive correlation between the proportion of Immigrants from Uruguay and percentage of population with at least 7th grade education in the United States with a correlation coefficient (R) of 0.325 and weighted average of 95.2%, a difference of 1.6%.
7th Grade Correlation Summary
| Measurement | Lebanese | Immigrants from Uruguay |
| Minimum | 89.5% | 85.9% |
| Maximum | 100.0% | 100.0% |
| Range | 10.5% | 14.1% |
| Mean | 98.0% | 96.0% |
| Median | 98.4% | 96.1% |
| Interquartile 25% (IQ1) | 97.0% | 95.0% |
| Interquartile 75% (IQ3) | 100.0% | 98.7% |
| Interquartile Range (IQR) | 3.0% | 3.7% |
| Standard Deviation (Sample) | 2.3% | 3.7% |
| Standard Deviation (Population) | 2.2% | 3.6% |
Similar Demographics by 7th Grade
Demographics Similar to Lebanese by 7th Grade
In terms of 7th grade, the demographic groups most similar to Lebanese are Immigrants from Australia (96.7%, a difference of 0.0%), Potawatomi (96.7%, a difference of 0.010%), Immigrants from Denmark (96.7%, a difference of 0.010%), Immigrants from South Africa (96.7%, a difference of 0.020%), and Osage (96.7%, a difference of 0.020%).
| Demographics | Rating | Rank | 7th Grade |
| Immigrants | Belgium | 99.0 /100 | #87 | Exceptional 96.7% |
| Puget Sound Salish | 99.0 /100 | #88 | Exceptional 96.7% |
| Cree | 99.0 /100 | #89 | Exceptional 96.7% |
| Immigrants | South Africa | 98.9 /100 | #90 | Exceptional 96.7% |
| Osage | 98.9 /100 | #91 | Exceptional 96.7% |
| Immigrants | Western Europe | 98.9 /100 | #92 | Exceptional 96.7% |
| Potawatomi | 98.9 /100 | #93 | Exceptional 96.7% |
| Lebanese | 98.8 /100 | #94 | Exceptional 96.7% |
| Immigrants | Australia | 98.8 /100 | #95 | Exceptional 96.7% |
| Immigrants | Denmark | 98.7 /100 | #96 | Exceptional 96.7% |
| Immigrants | Germany | 98.7 /100 | #97 | Exceptional 96.7% |
| Immigrants | Sweden | 98.7 /100 | #98 | Exceptional 96.7% |
| Menominee | 98.7 /100 | #99 | Exceptional 96.7% |
| German Russians | 98.6 /100 | #100 | Exceptional 96.7% |
| Thais | 98.6 /100 | #101 | Exceptional 96.7% |
Demographics Similar to Immigrants from Uruguay by 7th Grade
In terms of 7th grade, the demographic groups most similar to Immigrants from Uruguay are Immigrants from Ghana (95.2%, a difference of 0.0%), Yuman (95.2%, a difference of 0.020%), Immigrants from Hong Kong (95.2%, a difference of 0.020%), Immigrants from Nigeria (95.2%, a difference of 0.030%), and South American (95.2%, a difference of 0.050%).
| Demographics | Rating | Rank | 7th Grade |
| Ghanaians | 0.7 /100 | #258 | Tragic 95.3% |
| Immigrants | Costa Rica | 0.6 /100 | #259 | Tragic 95.3% |
| Afghans | 0.5 /100 | #260 | Tragic 95.3% |
| South Americans | 0.5 /100 | #261 | Tragic 95.2% |
| Immigrants | Somalia | 0.5 /100 | #262 | Tragic 95.2% |
| West Indians | 0.5 /100 | #263 | Tragic 95.2% |
| Immigrants | Nigeria | 0.4 /100 | #264 | Tragic 95.2% |
| Immigrants | Uruguay | 0.3 /100 | #265 | Tragic 95.2% |
| Immigrants | Ghana | 0.3 /100 | #266 | Tragic 95.2% |
| Yuman | 0.3 /100 | #267 | Tragic 95.2% |
| Immigrants | Hong Kong | 0.3 /100 | #268 | Tragic 95.2% |
| Trinidadians and Tobagonians | 0.3 /100 | #269 | Tragic 95.2% |
| Houma | 0.2 /100 | #270 | Tragic 95.1% |
| Immigrants | South America | 0.2 /100 | #271 | Tragic 95.1% |
| Peruvians | 0.2 /100 | #272 | Tragic 95.1% |