Laotian vs Immigrants from Kazakhstan 5th Grade

COMPARE

Laotian
Race
Ancestry
AfghanAfricanAlaska NativeAlaskan AthabascanAlbanianAleutAlsatianAmericanApacheArabArapahoArgentineanArmenianAssyrian/Chaldean/SyriacAustralianAustrianBahamianBangladeshiBarbadianBasqueBelgianBelizeanBermudanBhutaneseBlackfeetBolivianBrazilianBritishBritish West IndianBulgarianBurmeseCajunCambodianCanadianCape VerdeanCarpatho RusynCelticCentral AmericanCentral American IndianCherokeeCheyenneChickasawChileanChineseChippewaChoctawColombianColvilleComancheCosta RicanCreeCreekCroatianCrowCubanCypriotCzechCzechoslovakianDanishDelawareDominicanDutchDutch West IndianEastern EuropeanEcuadorianEgyptianEnglishEstonianEthiopianEuropeanFijianFilipinoFinnishFrenchFrench American IndianFrench CanadianGermanGerman RussianGhanaianGreekGuamanian/ChamorroGuatemalanGuyaneseHaitianHmongHonduranHopiHoumaHungarianIcelanderIndian (Asian)IndonesianInupiatIranianIraqiIrishIroquoisIsraeliItalianJamaicanJapaneseJordanianKenyanKiowaKoreanLaotianLatvianLebaneseLiberianLithuanianLumbeeLuxembourgerMacedonianMalaysianMalteseMarshalleseMenomineeMexicanMexican American IndianMongolianMoroccanNative HawaiianNavajoNepaleseNew ZealanderNicaraguanNigerianNorthern EuropeanNorwegianOkinawanOsageOttawaPaiutePakistaniPalestinianPanamanianParaguayanPennsylvania GermanPeruvianPimaPolishPortuguesePotawatomiPuebloPuerto RicanPuget Sound SalishRomanianRussianSalvadoranSamoanScandinavianScotch-IrishScottishSeminoleSenegaleseSerbianShoshoneSierra LeoneanSiouxSlavicSlovakSloveneSomaliSouth AfricanSouth AmericanSouth American IndianSoviet UnionSpaniardSpanishSpanish AmericanSpanish American IndianSri LankanSubsaharan AfricanSudaneseSwedishSwissSyrianTaiwaneseThaiTlingit-HaidaTohono O'OdhamTonganTrinidadian and TobagonianTsimshianTurkishU.S. Virgin IslanderUgandanUkrainianUruguayanUteVenezuelanVietnameseWelshWest IndianYakamaYaquiYugoslavianYumanYup'ikZimbabwean
Immigration
NonimmigrantsImmigrantsAfghanistanAfricaAlbaniaArgentinaArmeniaAsiaAustraliaAustriaBahamasBangladeshBarbadosBelarusBelgiumBelizeBoliviaBosnia and HerzegovinaBrazilBulgariaBurma/MyanmarCabo VerdeCambodiaCameroonCanadaCaribbeanCentral AmericaChileChinaColombiaCongoCosta RicaCroatiaCubaCzechoslovakiaDenmarkDominicaDominican RepublicEastern AfricaEastern AsiaEastern EuropeEcuadorEgyptEl SalvadorEnglandEritreaEthiopiaEuropeFijiFranceGermanyGhanaGreeceGrenadaGuatemalaGuyanaHaitiHondurasHong KongHungaryIndiaIndonesiaIranIraqIrelandIsraelItalyJamaicaJapanJordanKenyaKoreaKuwaitLaosLatin AmericaLatviaLebanonLiberiaLithuaniaMalaysiaMexicoMicronesiaMiddle AfricaMoldovaMoroccoNepalNetherlandsNicaraguaNigeriaNorth AmericaNorth MacedoniaNorthern AfricaNorthern EuropeNorwayOceaniaPakistanPanamaPeruPhilippinesPolandPortugalRomaniaRussiaSaudi ArabiaScotlandSenegalSerbiaSierra LeoneSingaporeSomaliaSouth AfricaSouth AmericaSouth Central AsiaSouth Eastern AsiaSouthern EuropeSpainSri LankaSt. Vincent and the GrenadinesSudanSwedenSwitzerlandSyriaTaiwanThailandTrinidad and TobagoTurkeyUgandaUkraineUruguayUzbekistanVenezuelaVietnamWest IndiesWestern AfricaWestern AsiaWestern EuropeYemenZaireZimbabweAzores
Immigrants from Kazakhstan
Race
Ancestry
AfghanAfricanAlaska NativeAlaskan AthabascanAlbanianAleutAlsatianAmericanApacheArabArapahoArgentineanArmenianAssyrian/Chaldean/SyriacAustralianAustrianBahamianBangladeshiBarbadianBasqueBelgianBelizeanBermudanBhutaneseBlackfeetBolivianBrazilianBritishBritish West IndianBulgarianBurmeseCajunCambodianCanadianCape VerdeanCarpatho RusynCelticCentral AmericanCentral American IndianCherokeeCheyenneChickasawChileanChineseChippewaChoctawColombianColvilleComancheCosta RicanCreeCreekCroatianCrowCubanCypriotCzechCzechoslovakianDanishDelawareDominicanDutchDutch West IndianEastern EuropeanEcuadorianEgyptianEnglishEstonianEthiopianEuropeanFijianFilipinoFinnishFrenchFrench American IndianFrench CanadianGermanGerman RussianGhanaianGreekGuamanian/ChamorroGuatemalanGuyaneseHaitianHmongHonduranHopiHoumaHungarianIcelanderIndian (Asian)IndonesianInupiatIranianIraqiIrishIroquoisIsraeliItalianJamaicanJapaneseJordanianKenyanKiowaKoreanLatvianLebaneseLiberianLithuanianLumbeeLuxembourgerMacedonianMalaysianMalteseMarshalleseMenomineeMexicanMexican American IndianMongolianMoroccanNative HawaiianNavajoNepaleseNew ZealanderNicaraguanNigerianNorthern EuropeanNorwegianOkinawanOsageOttawaPaiutePakistaniPalestinianPanamanianParaguayanPennsylvania GermanPeruvianPimaPolishPortuguesePotawatomiPuebloPuerto RicanPuget Sound SalishRomanianRussianSalvadoranSamoanScandinavianScotch-IrishScottishSeminoleSenegaleseSerbianShoshoneSierra LeoneanSiouxSlavicSlovakSloveneSomaliSouth AfricanSouth AmericanSouth American IndianSoviet UnionSpaniardSpanishSpanish AmericanSpanish American IndianSri LankanSubsaharan AfricanSudaneseSwedishSwissSyrianTaiwaneseThaiTlingit-HaidaTohono O'OdhamTonganTrinidadian and TobagonianTsimshianTurkishU.S. Virgin IslanderUgandanUkrainianUruguayanUteVenezuelanVietnameseWelshWest IndianYakamaYaquiYugoslavianYumanYup'ikZimbabwean
Immigration
NonimmigrantsImmigrantsAfghanistanAfricaAlbaniaArgentinaArmeniaAsiaAustraliaAustriaBahamasBangladeshBarbadosBelarusBelgiumBelizeBoliviaBosnia and HerzegovinaBrazilBulgariaBurma/MyanmarCabo VerdeCambodiaCameroonCanadaCaribbeanCentral AmericaChileChinaColombiaCongoCosta RicaCroatiaCubaCzechoslovakiaDenmarkDominicaDominican RepublicEastern AfricaEastern AsiaEastern EuropeEcuadorEgyptEl SalvadorEnglandEritreaEthiopiaEuropeFijiFranceGermanyGhanaGreeceGrenadaGuatemalaGuyanaHaitiHondurasHong KongHungaryIndiaIndonesiaIranIraqIrelandIsraelItalyJamaicaJapanJordanKazakhstanKenyaKoreaKuwaitLaosLatin AmericaLatviaLebanonLiberiaLithuaniaMalaysiaMexicoMicronesiaMiddle AfricaMoldovaMoroccoNepalNetherlandsNicaraguaNigeriaNorth AmericaNorth MacedoniaNorthern AfricaNorthern EuropeNorwayOceaniaPakistanPanamaPeruPhilippinesPolandPortugalRomaniaRussiaSaudi ArabiaScotlandSenegalSerbiaSierra LeoneSingaporeSomaliaSouth AfricaSouth AmericaSouth Central AsiaSouth Eastern AsiaSouthern EuropeSpainSri LankaSt. Vincent and the GrenadinesSudanSwedenSwitzerlandSyriaTaiwanThailandTrinidad and TobagoTurkeyUgandaUkraineUruguayUzbekistanVenezuelaVietnamWest IndiesWestern AfricaWestern AsiaWestern EuropeYemenZaireZimbabweAzores
5th Grade
Income
Poverty
Unemployment
Labor Participation
Family Structure
Vehicle Availability
Education Level
Disability

5th Grade Comparison

Laotians

Immigrants from Kazakhstan

Poor
Average
97.1%
5TH GRADE
10.8/ 100
METRIC RATING
208th/ 347
METRIC RANK
97.3%
5TH GRADE
50.0/ 100
METRIC RATING
174th/ 347
METRIC RANK

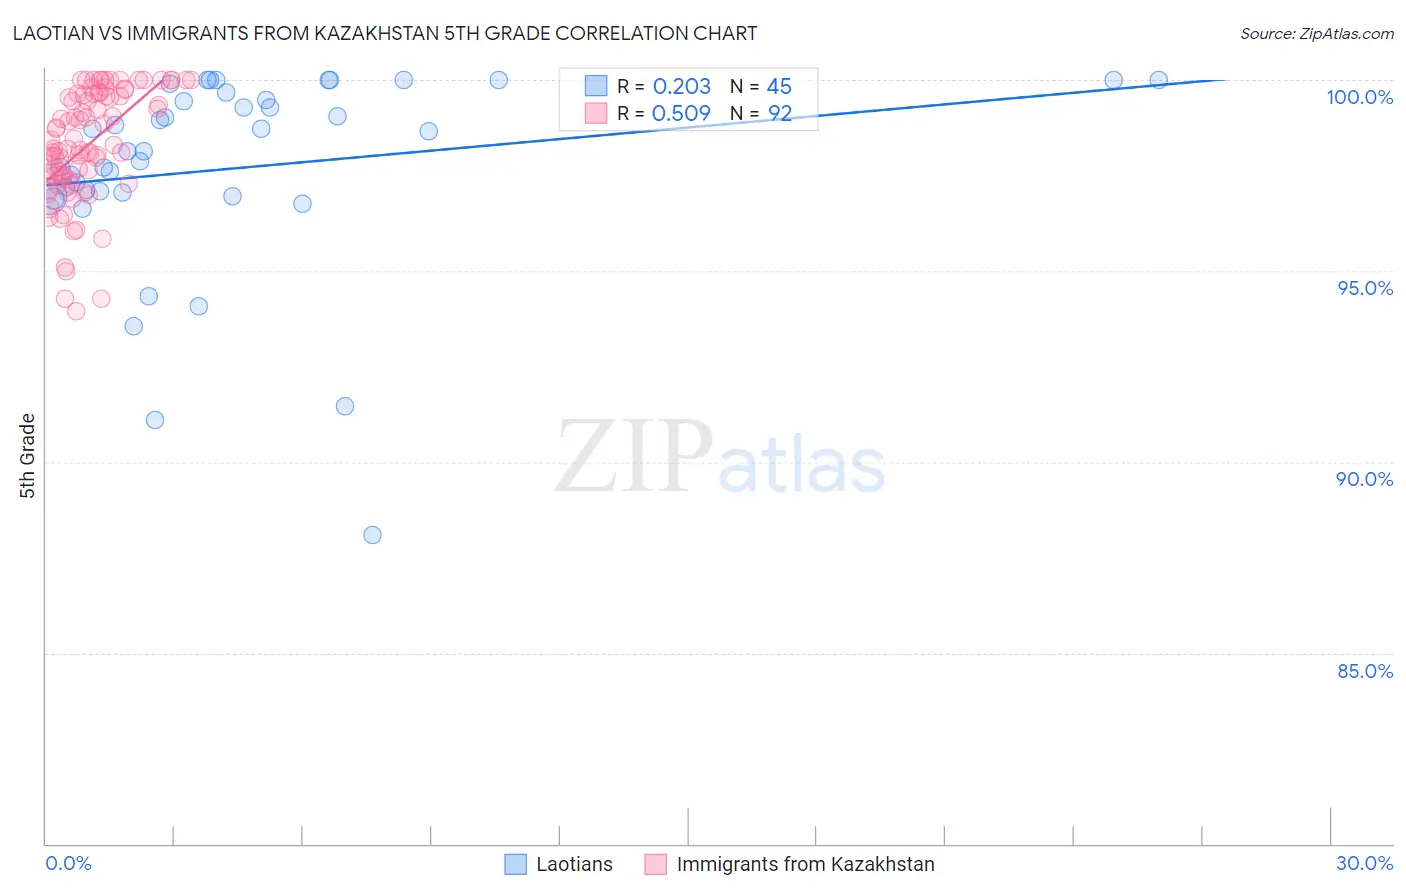
Laotian vs Immigrants from Kazakhstan 5th Grade Correlation Chart

The statistical analysis conducted on geographies consisting of 224,856,886 people shows a weak positive correlation between the proportion of Laotians and percentage of population with at least 5th grade education in the United States with a correlation coefficient (R) of 0.203 and weighted average of 97.1%. Similarly, the statistical analysis conducted on geographies consisting of 124,430,097 people shows a substantial positive correlation between the proportion of Immigrants from Kazakhstan and percentage of population with at least 5th grade education in the United States with a correlation coefficient (R) of 0.509 and weighted average of 97.3%, a difference of 0.22%.
Laotian vs Immigrants from Kazakhstan 5th Grade

5th Grade Correlation Summary

MeasurementLaotianImmigrants from Kazakhstan
Minimum88.1%93.9%
Maximum100.0%100.0%
Range11.9%6.1%
Mean97.7%98.3%
Median98.1%98.3%
Interquartile 25% (IQ1)97.0%97.5%
Interquartile 75% (IQ3)99.6%99.6%
Interquartile Range (IQR)2.6%2.2%
Standard Deviation (Sample)2.6%1.5%
Standard Deviation (Population)2.6%1.5%

Similar Demographics by 5th Grade

Demographics Similar to Laotians by 5th Grade

In terms of 5th grade, the demographic groups most similar to Laotians are Iraqi (97.1%, a difference of 0.0%), Moroccan (97.1%, a difference of 0.010%), Paiute (97.1%, a difference of 0.010%), Immigrants from Nepal (97.1%, a difference of 0.010%), and Immigrants from Oceania (97.1%, a difference of 0.010%).
DemographicsRating | Rank5th Grade
Immigrants | Chile
16.6
/100
|
#201
Poor
97.2%
Africans
15.3
/100
|
#202
Poor
97.2%
Immigrants | Bahamas
14.9
/100
|
#203
Poor
97.2%
Immigrants | Zaire
13.7
/100
|
#204
Poor
97.1%
Moroccans
12.0
/100
|
#205
Poor
97.1%
Paiute
11.6
/100
|
#206
Poor
97.1%
Iraqis
10.9
/100
|
#207
Poor
97.1%
Laotians
10.8
/100
|
#208
Poor
97.1%
Immigrants | Nepal
10.3
/100
|
#209
Poor
97.1%
Immigrants | Oceania
10.0
/100
|
#210
Poor
97.1%
Samoans
8.5
/100
|
#211
Tragic
97.1%
Immigrants | Iraq
8.3
/100
|
#212
Tragic
97.1%
Portuguese
7.8
/100
|
#213
Tragic
97.1%
Costa Ricans
7.7
/100
|
#214
Tragic
97.1%
Immigrants | Morocco
7.5
/100
|
#215
Tragic
97.1%

Demographics Similar to Immigrants from Kazakhstan by 5th Grade

In terms of 5th grade, the demographic groups most similar to Immigrants from Kazakhstan are Arab (97.3%, a difference of 0.010%), Egyptian (97.3%, a difference of 0.010%), Immigrants from Micronesia (97.3%, a difference of 0.010%), Immigrants from Taiwan (97.3%, a difference of 0.010%), and Immigrants from Spain (97.3%, a difference of 0.010%).
DemographicsRating | Rank5th Grade
Immigrants | Belarus
54.6
/100
|
#167
Average
97.3%
Chileans
54.5
/100
|
#168
Average
97.3%
Immigrants | Korea
54.1
/100
|
#169
Average
97.3%
Venezuelans
54.0
/100
|
#170
Average
97.3%
Immigrants | Sri Lanka
53.8
/100
|
#171
Average
97.3%
Arabs
53.4
/100
|
#172
Average
97.3%
Egyptians
52.4
/100
|
#173
Average
97.3%
Immigrants | Kazakhstan
50.0
/100
|
#174
Average
97.3%
Immigrants | Micronesia
48.8
/100
|
#175
Average
97.3%
Immigrants | Taiwan
48.4
/100
|
#176
Average
97.3%
Immigrants | Spain
47.0
/100
|
#177
Average
97.3%
Comanche
42.1
/100
|
#178
Average
97.3%
Immigrants | Kenya
40.3
/100
|
#179
Average
97.3%
Pakistanis
40.2
/100
|
#180
Average
97.3%
Argentineans
39.5
/100
|
#181
Fair
97.3%