Kiowa vs Immigrants from Moldova 9th Grade
COMPARE
Kiowa
Immigrants from Moldova
9th Grade
9th Grade Comparison
Kiowa
Immigrants from Moldova
95.4%
9TH GRADE
95.3/ 100
METRIC RATING
123rd/ 347
METRIC RANK
95.5%
9TH GRADE
97.9/ 100
METRIC RATING
101st/ 347
METRIC RANK
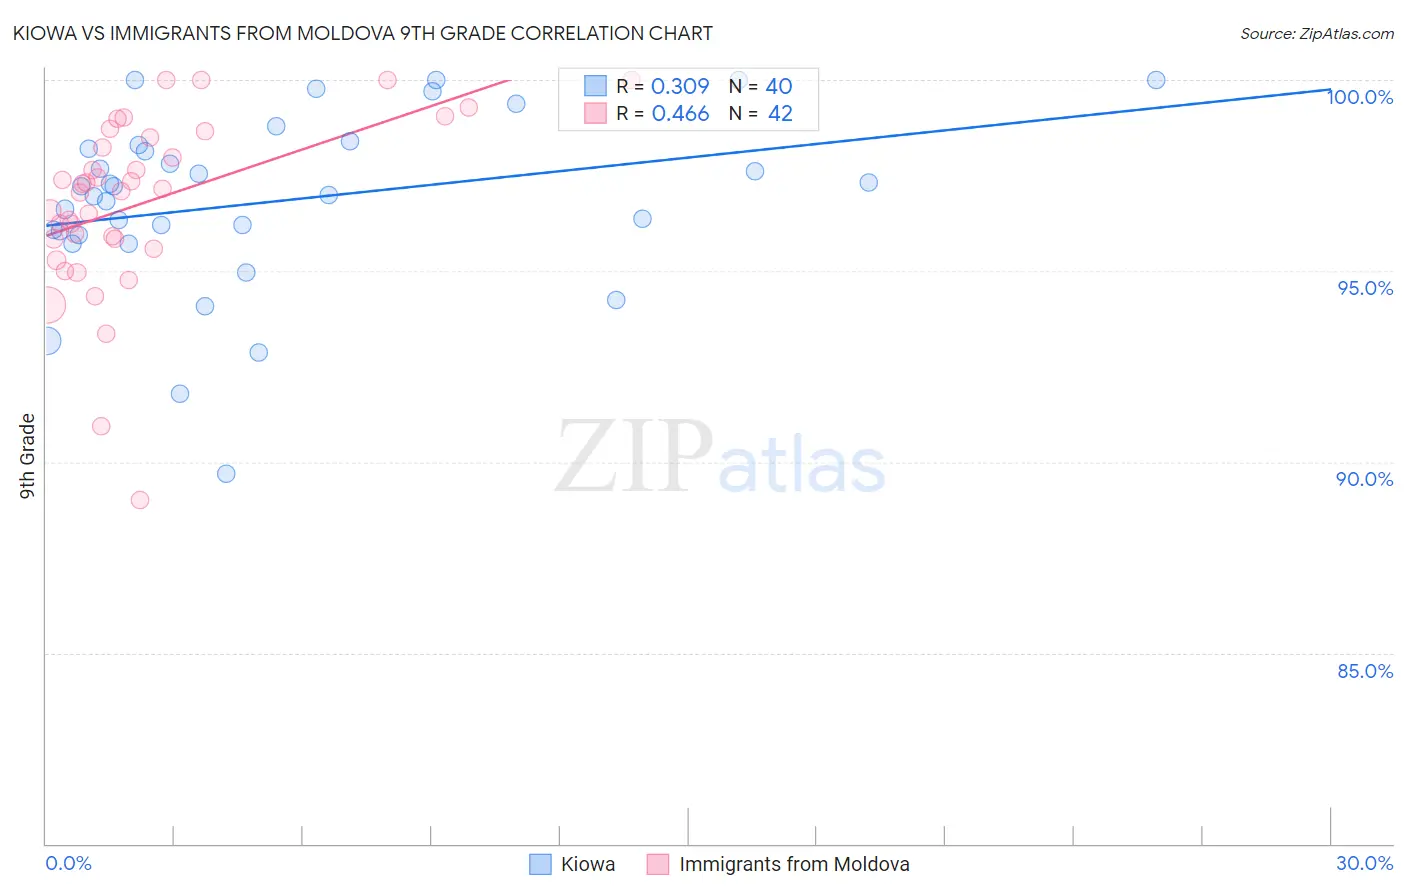
Kiowa vs Immigrants from Moldova 9th Grade Correlation Chart
The statistical analysis conducted on geographies consisting of 56,101,600 people shows a mild positive correlation between the proportion of Kiowa and percentage of population with at least 9th grade education in the United States with a correlation coefficient (R) of 0.309 and weighted average of 95.4%. Similarly, the statistical analysis conducted on geographies consisting of 124,396,843 people shows a moderate positive correlation between the proportion of Immigrants from Moldova and percentage of population with at least 9th grade education in the United States with a correlation coefficient (R) of 0.466 and weighted average of 95.5%, a difference of 0.15%.
9th Grade Correlation Summary
| Measurement | Kiowa | Immigrants from Moldova |
| Minimum | 89.7% | 89.0% |
| Maximum | 100.0% | 100.0% |
| Range | 10.3% | 11.0% |
| Mean | 96.8% | 96.8% |
| Median | 97.1% | 97.1% |
| Interquartile 25% (IQ1) | 96.0% | 95.8% |
| Interquartile 75% (IQ3) | 98.2% | 98.5% |
| Interquartile Range (IQR) | 2.2% | 2.6% |
| Standard Deviation (Sample) | 2.3% | 2.3% |
| Standard Deviation (Population) | 2.3% | 2.3% |
Similar Demographics by 9th Grade
Demographics Similar to Kiowa by 9th Grade
In terms of 9th grade, the demographic groups most similar to Kiowa are Shoshone (95.4%, a difference of 0.0%), Immigrants from Romania (95.4%, a difference of 0.010%), Immigrants from Turkey (95.4%, a difference of 0.010%), Soviet Union (95.4%, a difference of 0.010%), and Cambodian (95.4%, a difference of 0.010%).
| Demographics | Rating | Rank | 9th Grade |
| Immigrants | Europe | 95.7 /100 | #116 | Exceptional 95.4% |
| Immigrants | Romania | 95.6 /100 | #117 | Exceptional 95.4% |
| Immigrants | Turkey | 95.6 /100 | #118 | Exceptional 95.4% |
| Soviet Union | 95.6 /100 | #119 | Exceptional 95.4% |
| Cambodians | 95.6 /100 | #120 | Exceptional 95.4% |
| Cree | 95.5 /100 | #121 | Exceptional 95.4% |
| Immigrants | Kuwait | 95.5 /100 | #122 | Exceptional 95.4% |
| Kiowa | 95.3 /100 | #123 | Exceptional 95.4% |
| Shoshone | 95.3 /100 | #124 | Exceptional 95.4% |
| Immigrants | South Central Asia | 95.1 /100 | #125 | Exceptional 95.4% |
| Immigrants | Serbia | 94.4 /100 | #126 | Exceptional 95.4% |
| Palestinians | 94.3 /100 | #127 | Exceptional 95.4% |
| Immigrants | Hungary | 94.2 /100 | #128 | Exceptional 95.4% |
| Basques | 94.1 /100 | #129 | Exceptional 95.4% |
| Jordanians | 93.5 /100 | #130 | Exceptional 95.3% |
Demographics Similar to Immigrants from Moldova by 9th Grade
In terms of 9th grade, the demographic groups most similar to Immigrants from Moldova are Immigrants from Switzerland (95.5%, a difference of 0.010%), Lebanese (95.6%, a difference of 0.020%), Potawatomi (95.5%, a difference of 0.020%), Menominee (95.6%, a difference of 0.040%), and Syrian (95.5%, a difference of 0.040%).
| Demographics | Rating | Rank | 9th Grade |
| Immigrants | Latvia | 98.7 /100 | #94 | Exceptional 95.6% |
| Americans | 98.5 /100 | #95 | Exceptional 95.6% |
| Filipinos | 98.5 /100 | #96 | Exceptional 95.6% |
| Delaware | 98.4 /100 | #97 | Exceptional 95.6% |
| Immigrants | Japan | 98.4 /100 | #98 | Exceptional 95.6% |
| Menominee | 98.3 /100 | #99 | Exceptional 95.6% |
| Lebanese | 98.1 /100 | #100 | Exceptional 95.6% |
| Immigrants | Moldova | 97.9 /100 | #101 | Exceptional 95.5% |
| Immigrants | Switzerland | 97.7 /100 | #102 | Exceptional 95.5% |
| Potawatomi | 97.7 /100 | #103 | Exceptional 95.5% |
| Syrians | 97.4 /100 | #104 | Exceptional 95.5% |
| Immigrants | France | 97.4 /100 | #105 | Exceptional 95.5% |
| Immigrants | Norway | 97.1 /100 | #106 | Exceptional 95.5% |
| Immigrants | Zimbabwe | 96.9 /100 | #107 | Exceptional 95.5% |
| Chickasaw | 96.8 /100 | #108 | Exceptional 95.5% |