Kenyan vs Immigrants from England 2nd Grade
COMPARE
Kenyan
Immigrants from England
2nd Grade
2nd Grade Comparison
Kenyans
Immigrants from England
97.9%
2ND GRADE
52.7/ 100
METRIC RATING
173rd/ 347
METRIC RANK
98.3%
2ND GRADE
99.4/ 100
METRIC RATING
77th/ 347
METRIC RANK
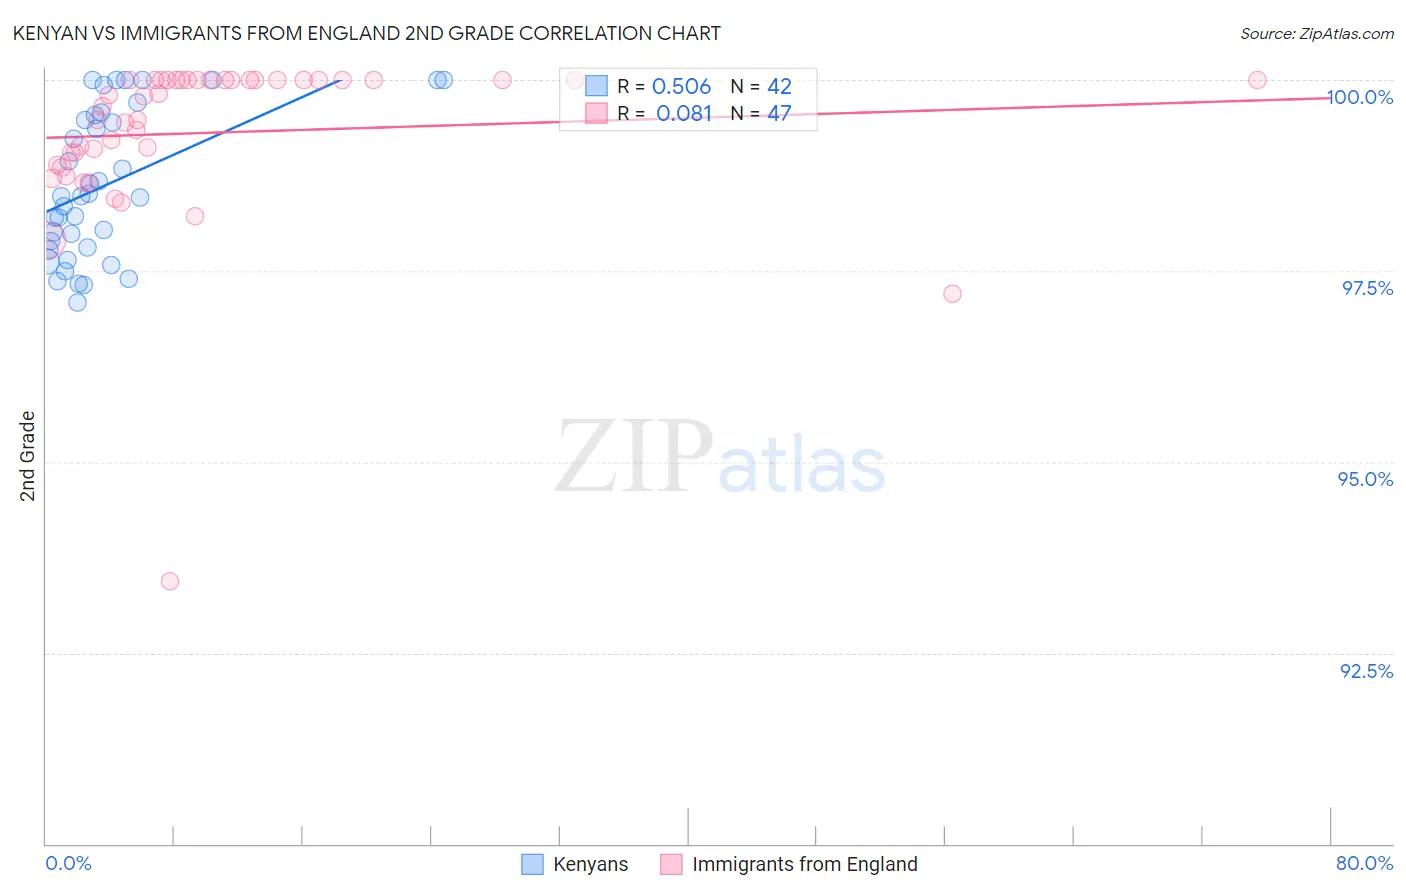
Kenyan vs Immigrants from England 2nd Grade Correlation Chart
The statistical analysis conducted on geographies consisting of 168,244,481 people shows a substantial positive correlation between the proportion of Kenyans and percentage of population with at least 2nd grade education in the United States with a correlation coefficient (R) of 0.506 and weighted average of 97.9%. Similarly, the statistical analysis conducted on geographies consisting of 391,898,018 people shows a slight positive correlation between the proportion of Immigrants from England and percentage of population with at least 2nd grade education in the United States with a correlation coefficient (R) of 0.081 and weighted average of 98.3%, a difference of 0.39%.
2nd Grade Correlation Summary
| Measurement | Kenyan | Immigrants from England |
| Minimum | 97.1% | 93.4% |
| Maximum | 100.0% | 100.0% |
| Range | 2.9% | 6.6% |
| Mean | 98.6% | 99.3% |
| Median | 98.5% | 99.8% |
| Interquartile 25% (IQ1) | 97.8% | 98.9% |
| Interquartile 75% (IQ3) | 99.5% | 100.0% |
| Interquartile Range (IQR) | 1.7% | 1.1% |
| Standard Deviation (Sample) | 0.95% | 1.1% |
| Standard Deviation (Population) | 0.94% | 1.1% |
Similar Demographics by 2nd Grade
Demographics Similar to Kenyans by 2nd Grade
In terms of 2nd grade, the demographic groups most similar to Kenyans are Albanian (97.9%, a difference of 0.0%), Immigrants from Korea (97.9%, a difference of 0.0%), Immigrants from Jordan (97.9%, a difference of 0.010%), Chilean (97.9%, a difference of 0.010%), and Brazilian (97.9%, a difference of 0.010%).
| Demographics | Rating | Rank | 2nd Grade |
| Immigrants | Jordan | 56.3 /100 | #166 | Average 97.9% |
| Chileans | 56.1 /100 | #167 | Average 97.9% |
| Brazilians | 55.8 /100 | #168 | Average 97.9% |
| Immigrants | Spain | 55.4 /100 | #169 | Average 97.9% |
| Navajo | 54.3 /100 | #170 | Average 97.9% |
| Albanians | 52.8 /100 | #171 | Average 97.9% |
| Immigrants | Korea | 52.7 /100 | #172 | Average 97.9% |
| Kenyans | 52.7 /100 | #173 | Average 97.9% |
| Immigrants | Micronesia | 50.0 /100 | #174 | Average 97.9% |
| Immigrants | Bosnia and Herzegovina | 49.8 /100 | #175 | Average 97.9% |
| Immigrants | Sri Lanka | 48.7 /100 | #176 | Average 97.9% |
| Immigrants | Brazil | 46.6 /100 | #177 | Average 97.9% |
| Argentineans | 46.3 /100 | #178 | Average 97.9% |
| Immigrants | Venezuela | 46.1 /100 | #179 | Average 97.9% |
| Natives/Alaskans | 44.3 /100 | #180 | Average 97.9% |
Demographics Similar to Immigrants from England by 2nd Grade
In terms of 2nd grade, the demographic groups most similar to Immigrants from England are Shoshone (98.3%, a difference of 0.0%), Cherokee (98.3%, a difference of 0.0%), Immigrants from Netherlands (98.3%, a difference of 0.010%), Immigrants from Lithuania (98.2%, a difference of 0.010%), and Immigrants from Belgium (98.2%, a difference of 0.010%).
| Demographics | Rating | Rank | 2nd Grade |
| Serbians | 99.6 /100 | #70 | Exceptional 98.3% |
| Chickasaw | 99.6 /100 | #71 | Exceptional 98.3% |
| Cheyenne | 99.6 /100 | #72 | Exceptional 98.3% |
| Cajuns | 99.5 /100 | #73 | Exceptional 98.3% |
| Immigrants | Netherlands | 99.4 /100 | #74 | Exceptional 98.3% |
| Shoshone | 99.4 /100 | #75 | Exceptional 98.3% |
| Cherokee | 99.4 /100 | #76 | Exceptional 98.3% |
| Immigrants | England | 99.4 /100 | #77 | Exceptional 98.3% |
| Immigrants | Lithuania | 99.3 /100 | #78 | Exceptional 98.2% |
| Immigrants | Belgium | 99.3 /100 | #79 | Exceptional 98.2% |
| Osage | 99.2 /100 | #80 | Exceptional 98.2% |
| Icelanders | 99.2 /100 | #81 | Exceptional 98.2% |
| Delaware | 99.1 /100 | #82 | Exceptional 98.2% |
| Immigrants | Sweden | 99.1 /100 | #83 | Exceptional 98.2% |
| Hopi | 99.1 /100 | #84 | Exceptional 98.2% |