Israeli vs Immigrants from Nicaragua Associate's Degree
COMPARE
Israeli
Immigrants from Nicaragua
Associate's Degree
Associate's Degree Comparison
Israelis
Immigrants from Nicaragua
53.4%
ASSOCIATE'S DEGREE
100.0/ 100
METRIC RATING
33rd/ 347
METRIC RANK
40.3%
ASSOCIATE'S DEGREE
0.1/ 100
METRIC RATING
279th/ 347
METRIC RANK
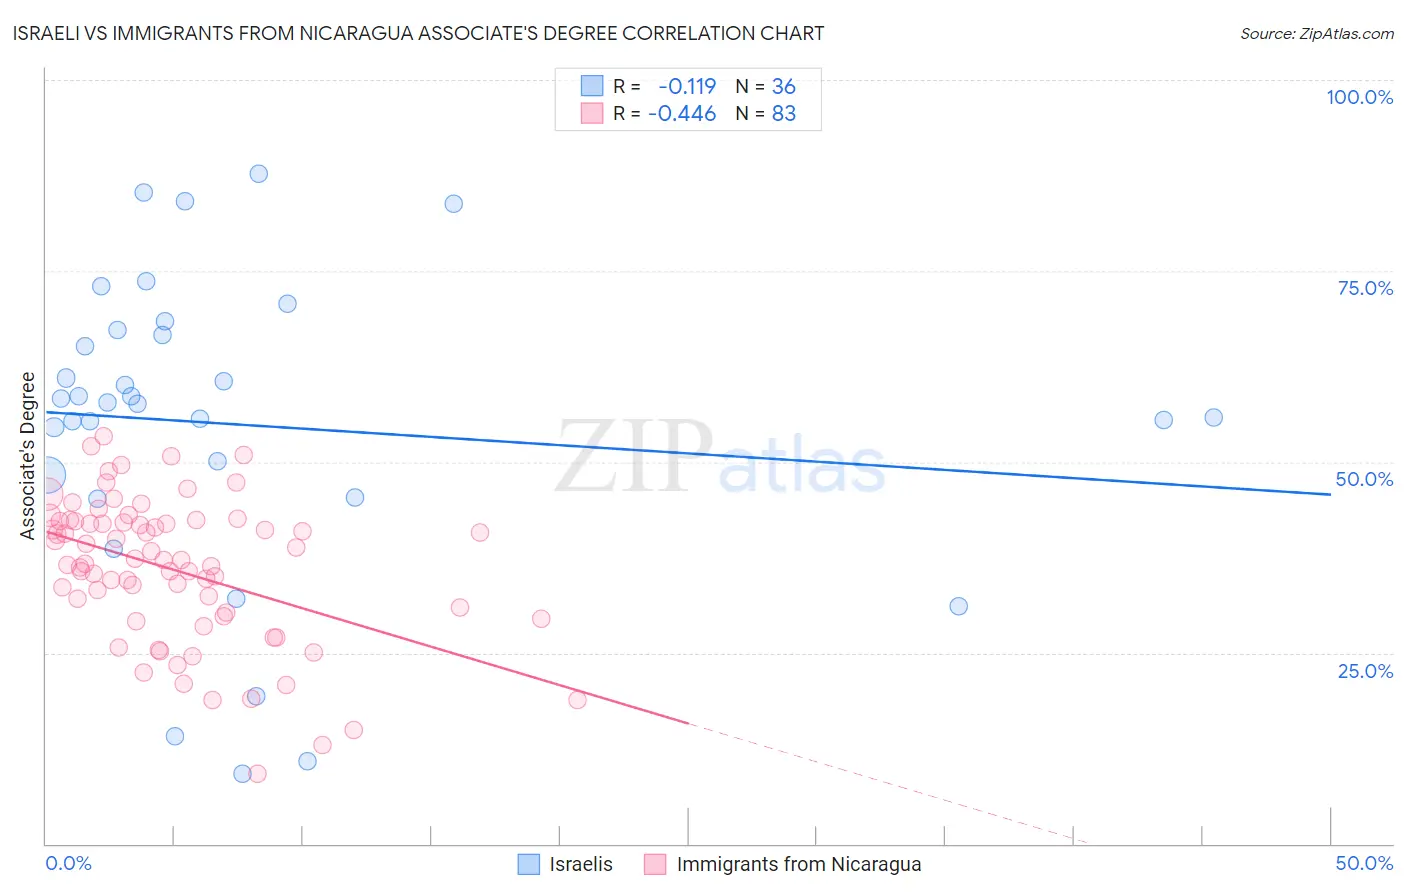
Israeli vs Immigrants from Nicaragua Associate's Degree Correlation Chart
The statistical analysis conducted on geographies consisting of 211,190,630 people shows a poor negative correlation between the proportion of Israelis and percentage of population with at least associate's degree education in the United States with a correlation coefficient (R) of -0.119 and weighted average of 53.4%. Similarly, the statistical analysis conducted on geographies consisting of 236,338,316 people shows a moderate negative correlation between the proportion of Immigrants from Nicaragua and percentage of population with at least associate's degree education in the United States with a correlation coefficient (R) of -0.446 and weighted average of 40.3%, a difference of 32.6%.
Associate's Degree Correlation Summary
| Measurement | Israeli | Immigrants from Nicaragua |
| Minimum | 9.1% | 9.1% |
| Maximum | 87.7% | 53.3% |
| Range | 78.6% | 44.2% |
| Mean | 54.8% | 35.9% |
| Median | 57.7% | 37.1% |
| Interquartile 25% (IQ1) | 46.9% | 29.7% |
| Interquartile 75% (IQ3) | 66.9% | 42.2% |
| Interquartile Range (IQR) | 20.0% | 12.4% |
| Standard Deviation (Sample) | 19.9% | 9.4% |
| Standard Deviation (Population) | 19.7% | 9.3% |
Similar Demographics by Associate's Degree
Demographics Similar to Israelis by Associate's Degree
In terms of associate's degree, the demographic groups most similar to Israelis are Immigrants from Turkey (53.4%, a difference of 0.12%), Immigrants from Northern Europe (53.5%, a difference of 0.15%), Bulgarian (53.3%, a difference of 0.19%), Russian (53.2%, a difference of 0.26%), and Immigrants from Sri Lanka (53.7%, a difference of 0.51%).
| Demographics | Rating | Rank | Associate's Degree |
| Immigrants | Belgium | 100.0 /100 | #26 | Exceptional 54.5% |
| Latvians | 100.0 /100 | #27 | Exceptional 53.9% |
| Turks | 100.0 /100 | #28 | Exceptional 53.9% |
| Immigrants | France | 100.0 /100 | #29 | Exceptional 53.9% |
| Immigrants | Sri Lanka | 100.0 /100 | #30 | Exceptional 53.7% |
| Immigrants | Northern Europe | 100.0 /100 | #31 | Exceptional 53.5% |
| Immigrants | Turkey | 100.0 /100 | #32 | Exceptional 53.4% |
| Israelis | 100.0 /100 | #33 | Exceptional 53.4% |
| Bulgarians | 100.0 /100 | #34 | Exceptional 53.3% |
| Russians | 100.0 /100 | #35 | Exceptional 53.2% |
| Immigrants | Russia | 100.0 /100 | #36 | Exceptional 53.1% |
| Immigrants | Denmark | 100.0 /100 | #37 | Exceptional 53.1% |
| Mongolians | 100.0 /100 | #38 | Exceptional 53.0% |
| Immigrants | Belarus | 99.9 /100 | #39 | Exceptional 52.8% |
| Immigrants | Latvia | 99.9 /100 | #40 | Exceptional 52.8% |
Demographics Similar to Immigrants from Nicaragua by Associate's Degree
In terms of associate's degree, the demographic groups most similar to Immigrants from Nicaragua are Ottawa (40.3%, a difference of 0.040%), Blackfeet (40.3%, a difference of 0.19%), Immigrants from Micronesia (40.2%, a difference of 0.20%), Puerto Rican (40.4%, a difference of 0.24%), and Immigrants from Portugal (40.1%, a difference of 0.30%).
| Demographics | Rating | Rank | Associate's Degree |
| Belizeans | 0.1 /100 | #272 | Tragic 40.6% |
| Puget Sound Salish | 0.1 /100 | #273 | Tragic 40.5% |
| Immigrants | Dominica | 0.1 /100 | #274 | Tragic 40.5% |
| Potawatomi | 0.1 /100 | #275 | Tragic 40.4% |
| Puerto Ricans | 0.1 /100 | #276 | Tragic 40.4% |
| Blackfeet | 0.1 /100 | #277 | Tragic 40.3% |
| Ottawa | 0.1 /100 | #278 | Tragic 40.3% |
| Immigrants | Nicaragua | 0.1 /100 | #279 | Tragic 40.3% |
| Immigrants | Micronesia | 0.1 /100 | #280 | Tragic 40.2% |
| Immigrants | Portugal | 0.1 /100 | #281 | Tragic 40.1% |
| Bangladeshis | 0.1 /100 | #282 | Tragic 40.0% |
| Haitians | 0.1 /100 | #283 | Tragic 40.0% |
| Comanche | 0.1 /100 | #284 | Tragic 39.9% |
| Immigrants | Belize | 0.1 /100 | #285 | Tragic 39.9% |
| Immigrants | Caribbean | 0.0 /100 | #286 | Tragic 39.7% |