Iraqi vs Immigrants from West Indies 1st Grade
COMPARE
Iraqi
Immigrants from West Indies
1st Grade
1st Grade Comparison
Iraqis
Immigrants from West Indies
97.7%
1ST GRADE
4.0/ 100
METRIC RATING
224th/ 347
METRIC RANK
97.3%
1ST GRADE
0.0/ 100
METRIC RATING
283rd/ 347
METRIC RANK
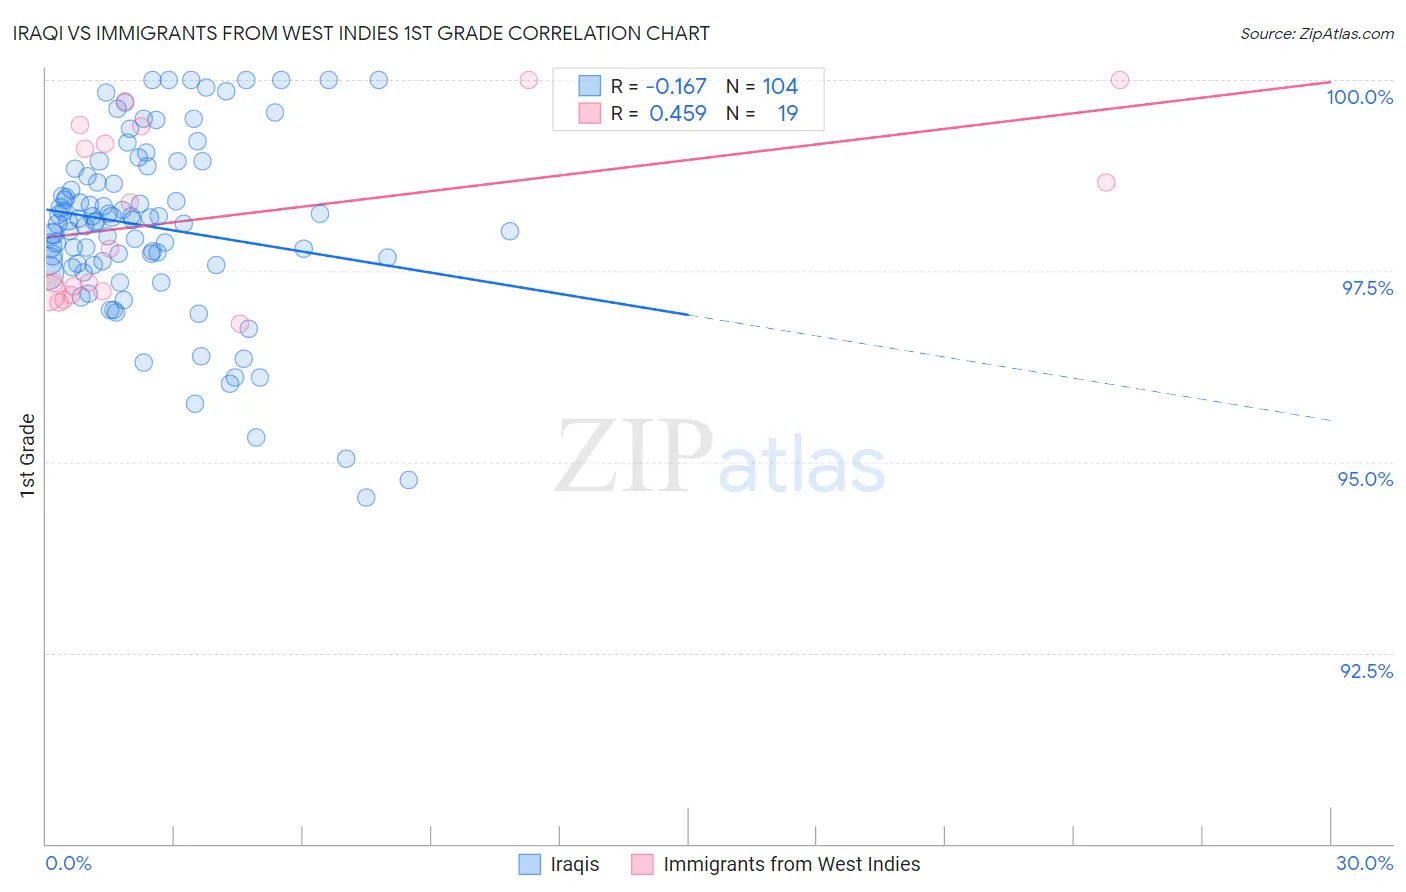
Iraqi vs Immigrants from West Indies 1st Grade Correlation Chart
The statistical analysis conducted on geographies consisting of 170,561,413 people shows a poor negative correlation between the proportion of Iraqis and percentage of population with at least 1st grade education in the United States with a correlation coefficient (R) of -0.167 and weighted average of 97.7%. Similarly, the statistical analysis conducted on geographies consisting of 72,457,514 people shows a moderate positive correlation between the proportion of Immigrants from West Indies and percentage of population with at least 1st grade education in the United States with a correlation coefficient (R) of 0.459 and weighted average of 97.3%, a difference of 0.38%.
1st Grade Correlation Summary
| Measurement | Iraqi | Immigrants from West Indies |
| Minimum | 94.5% | 96.8% |
| Maximum | 100.0% | 100.0% |
| Range | 5.5% | 3.2% |
| Mean | 98.1% | 98.2% |
| Median | 98.1% | 97.8% |
| Interquartile 25% (IQ1) | 97.6% | 97.2% |
| Interquartile 75% (IQ3) | 98.8% | 99.4% |
| Interquartile Range (IQR) | 1.2% | 2.2% |
| Standard Deviation (Sample) | 1.2% | 1.1% |
| Standard Deviation (Population) | 1.2% | 1.1% |
Similar Demographics by 1st Grade
Demographics Similar to Iraqis by 1st Grade
In terms of 1st grade, the demographic groups most similar to Iraqis are Immigrants from Syria (97.7%, a difference of 0.0%), Immigrants from Zaire (97.7%, a difference of 0.0%), Immigrants from Nepal (97.7%, a difference of 0.0%), Tongan (97.7%, a difference of 0.010%), and Immigrants from Sudan (97.7%, a difference of 0.010%).
| Demographics | Rating | Rank | 1st Grade |
| Samoans | 6.8 /100 | #217 | Tragic 97.7% |
| Immigrants | Morocco | 5.3 /100 | #218 | Tragic 97.7% |
| Immigrants | Panama | 5.2 /100 | #219 | Tragic 97.7% |
| Tongans | 4.6 /100 | #220 | Tragic 97.7% |
| Immigrants | Sudan | 4.3 /100 | #221 | Tragic 97.7% |
| Immigrants | Syria | 4.2 /100 | #222 | Tragic 97.7% |
| Immigrants | Zaire | 4.1 /100 | #223 | Tragic 97.7% |
| Iraqis | 4.0 /100 | #224 | Tragic 97.7% |
| Immigrants | Nepal | 4.0 /100 | #225 | Tragic 97.7% |
| Sudanese | 3.7 /100 | #226 | Tragic 97.7% |
| Sierra Leoneans | 3.6 /100 | #227 | Tragic 97.7% |
| Sub-Saharan Africans | 3.6 /100 | #228 | Tragic 97.7% |
| Immigrants | Costa Rica | 3.5 /100 | #229 | Tragic 97.7% |
| Senegalese | 3.5 /100 | #230 | Tragic 97.7% |
| Puerto Ricans | 3.0 /100 | #231 | Tragic 97.7% |
Demographics Similar to Immigrants from West Indies by 1st Grade
In terms of 1st grade, the demographic groups most similar to Immigrants from West Indies are Immigrants from Trinidad and Tobago (97.3%, a difference of 0.010%), Immigrants from Portugal (97.3%, a difference of 0.010%), Immigrants from Barbados (97.3%, a difference of 0.020%), Afghan (97.4%, a difference of 0.040%), and Trinidadian and Tobagonian (97.3%, a difference of 0.040%).
| Demographics | Rating | Rank | 1st Grade |
| Immigrants | Philippines | 0.1 /100 | #276 | Tragic 97.4% |
| Immigrants | Western Africa | 0.1 /100 | #277 | Tragic 97.4% |
| Immigrants | Uzbekistan | 0.1 /100 | #278 | Tragic 97.4% |
| Immigrants | Ghana | 0.1 /100 | #279 | Tragic 97.4% |
| Afghans | 0.1 /100 | #280 | Tragic 97.4% |
| Trinidadians and Tobagonians | 0.1 /100 | #281 | Tragic 97.3% |
| Barbadians | 0.1 /100 | #282 | Tragic 97.3% |
| Immigrants | West Indies | 0.0 /100 | #283 | Tragic 97.3% |
| Immigrants | Trinidad and Tobago | 0.0 /100 | #284 | Tragic 97.3% |
| Immigrants | Portugal | 0.0 /100 | #285 | Tragic 97.3% |
| Immigrants | Barbados | 0.0 /100 | #286 | Tragic 97.3% |
| Immigrants | Hong Kong | 0.0 /100 | #287 | Tragic 97.3% |
| Immigrants | Thailand | 0.0 /100 | #288 | Tragic 97.3% |
| Immigrants | Afghanistan | 0.0 /100 | #289 | Tragic 97.3% |
| Immigrants | St. Vincent and the Grenadines | 0.0 /100 | #290 | Tragic 97.3% |