Iraqi vs Immigrants from Senegal 7th Grade
COMPARE
Iraqi
Immigrants from Senegal
7th Grade
7th Grade Comparison
Iraqis
Immigrants from Senegal
96.0%
7TH GRADE
41.2/ 100
METRIC RATING
182nd/ 347
METRIC RANK
95.5%
7TH GRADE
1.9/ 100
METRIC RATING
242nd/ 347
METRIC RANK
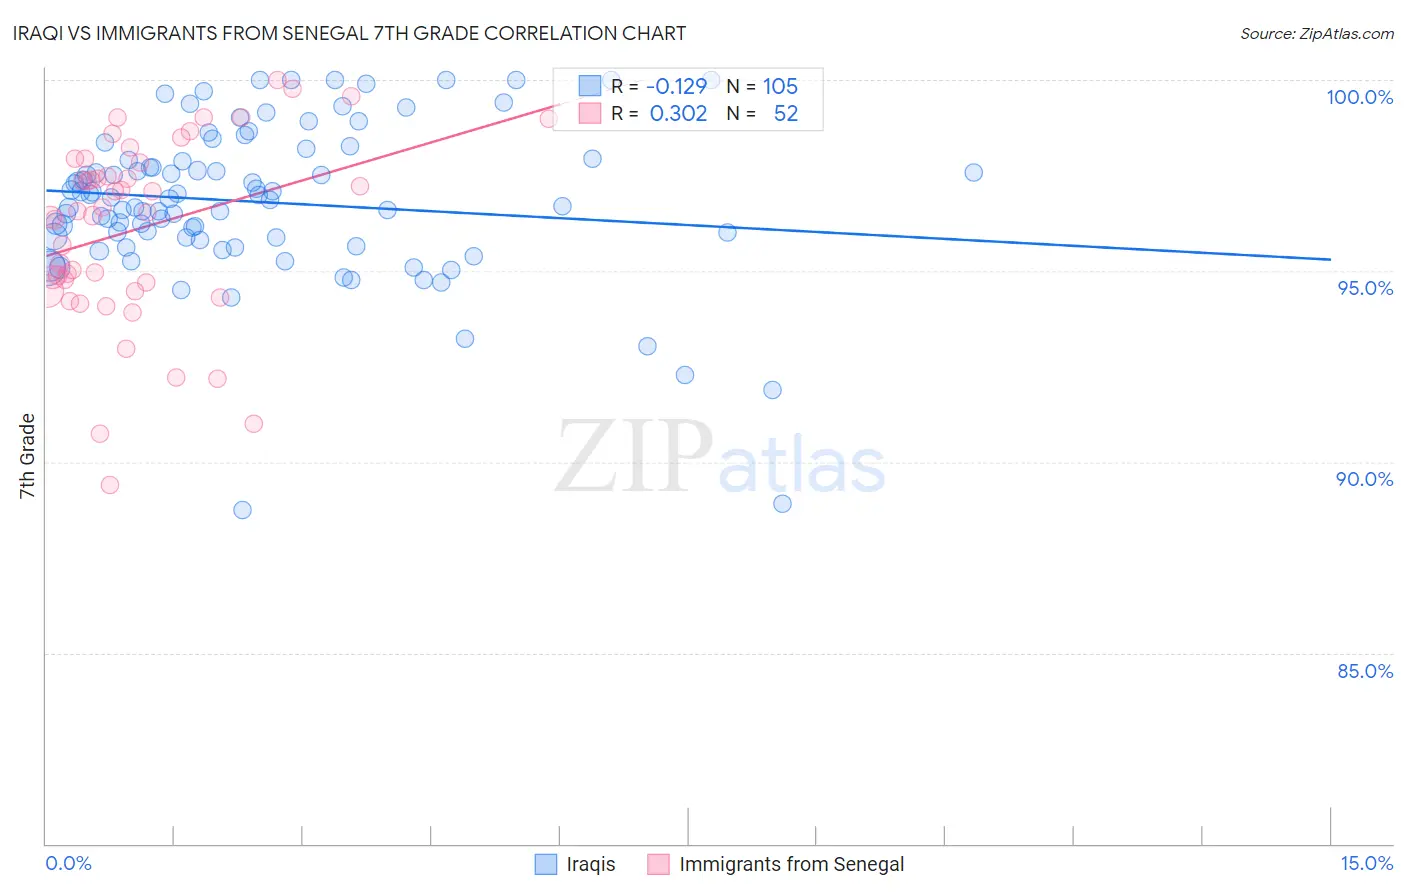
Iraqi vs Immigrants from Senegal 7th Grade Correlation Chart
The statistical analysis conducted on geographies consisting of 170,614,457 people shows a poor negative correlation between the proportion of Iraqis and percentage of population with at least 7th grade education in the United States with a correlation coefficient (R) of -0.129 and weighted average of 96.0%. Similarly, the statistical analysis conducted on geographies consisting of 90,130,297 people shows a mild positive correlation between the proportion of Immigrants from Senegal and percentage of population with at least 7th grade education in the United States with a correlation coefficient (R) of 0.302 and weighted average of 95.5%, a difference of 0.55%.
7th Grade Correlation Summary
| Measurement | Iraqi | Immigrants from Senegal |
| Minimum | 88.7% | 89.4% |
| Maximum | 100.0% | 100.0% |
| Range | 11.3% | 10.6% |
| Mean | 96.8% | 96.1% |
| Median | 96.9% | 96.6% |
| Interquartile 25% (IQ1) | 95.8% | 94.6% |
| Interquartile 75% (IQ3) | 97.9% | 97.9% |
| Interquartile Range (IQR) | 2.1% | 3.3% |
| Standard Deviation (Sample) | 2.1% | 2.4% |
| Standard Deviation (Population) | 2.0% | 2.4% |
Similar Demographics by 7th Grade
Demographics Similar to Iraqis by 7th Grade
In terms of 7th grade, the demographic groups most similar to Iraqis are Pakistani (96.0%, a difference of 0.020%), Immigrants from Spain (96.0%, a difference of 0.020%), Sierra Leonean (96.0%, a difference of 0.020%), Immigrants from Brazil (96.0%, a difference of 0.030%), and Brazilian (96.0%, a difference of 0.030%).
| Demographics | Rating | Rank | 7th Grade |
| Blacks/African Americans | 49.5 /100 | #175 | Average 96.0% |
| Chileans | 49.3 /100 | #176 | Average 96.0% |
| Immigrants | Korea | 49.2 /100 | #177 | Average 96.0% |
| Marshallese | 48.4 /100 | #178 | Average 96.0% |
| Immigrants | Iran | 47.8 /100 | #179 | Average 96.0% |
| Immigrants | Brazil | 46.8 /100 | #180 | Average 96.0% |
| Pakistanis | 44.5 /100 | #181 | Average 96.0% |
| Iraqis | 41.2 /100 | #182 | Average 96.0% |
| Immigrants | Spain | 38.8 /100 | #183 | Fair 96.0% |
| Sierra Leoneans | 37.5 /100 | #184 | Fair 96.0% |
| Brazilians | 37.3 /100 | #185 | Fair 96.0% |
| Immigrants | Iraq | 36.1 /100 | #186 | Fair 96.0% |
| Immigrants | Uganda | 36.0 /100 | #187 | Fair 96.0% |
| Immigrants | Egypt | 34.3 /100 | #188 | Fair 95.9% |
| Immigrants | Venezuela | 33.9 /100 | #189 | Fair 95.9% |
Demographics Similar to Immigrants from Senegal by 7th Grade
In terms of 7th grade, the demographic groups most similar to Immigrants from Senegal are Immigrants from Sierra Leone (95.5%, a difference of 0.0%), South American Indian (95.5%, a difference of 0.0%), Jamaican (95.5%, a difference of 0.020%), U.S. Virgin Islander (95.4%, a difference of 0.020%), and Immigrants from Asia (95.5%, a difference of 0.030%).
| Demographics | Rating | Rank | 7th Grade |
| Immigrants | Africa | 2.7 /100 | #235 | Tragic 95.5% |
| Asians | 2.6 /100 | #236 | Tragic 95.5% |
| Immigrants | Asia | 2.3 /100 | #237 | Tragic 95.5% |
| Indians (Asian) | 2.3 /100 | #238 | Tragic 95.5% |
| Jamaicans | 2.2 /100 | #239 | Tragic 95.5% |
| Immigrants | Sierra Leone | 2.0 /100 | #240 | Tragic 95.5% |
| South American Indians | 2.0 /100 | #241 | Tragic 95.5% |
| Immigrants | Senegal | 1.9 /100 | #242 | Tragic 95.5% |
| U.S. Virgin Islanders | 1.6 /100 | #243 | Tragic 95.4% |
| Uruguayans | 1.6 /100 | #244 | Tragic 95.4% |
| Immigrants | Middle Africa | 1.5 /100 | #245 | Tragic 95.4% |
| Ethiopians | 1.5 /100 | #246 | Tragic 95.4% |
| Tongans | 1.3 /100 | #247 | Tragic 95.4% |
| Paiute | 1.2 /100 | #248 | Tragic 95.4% |
| Bolivians | 1.1 /100 | #249 | Tragic 95.4% |