Iraqi vs Immigrants from Lebanon 12th Grade, No Diploma
COMPARE
Iraqi
Immigrants from Lebanon
12th Grade, No Diploma
12th Grade, No Diploma Comparison
Iraqis
Immigrants from Lebanon
91.5%
12TH GRADE, NO DIPLOMA
75.3/ 100
METRIC RATING
153rd/ 347
METRIC RANK
91.6%
12TH GRADE, NO DIPLOMA
80.0/ 100
METRIC RATING
145th/ 347
METRIC RANK
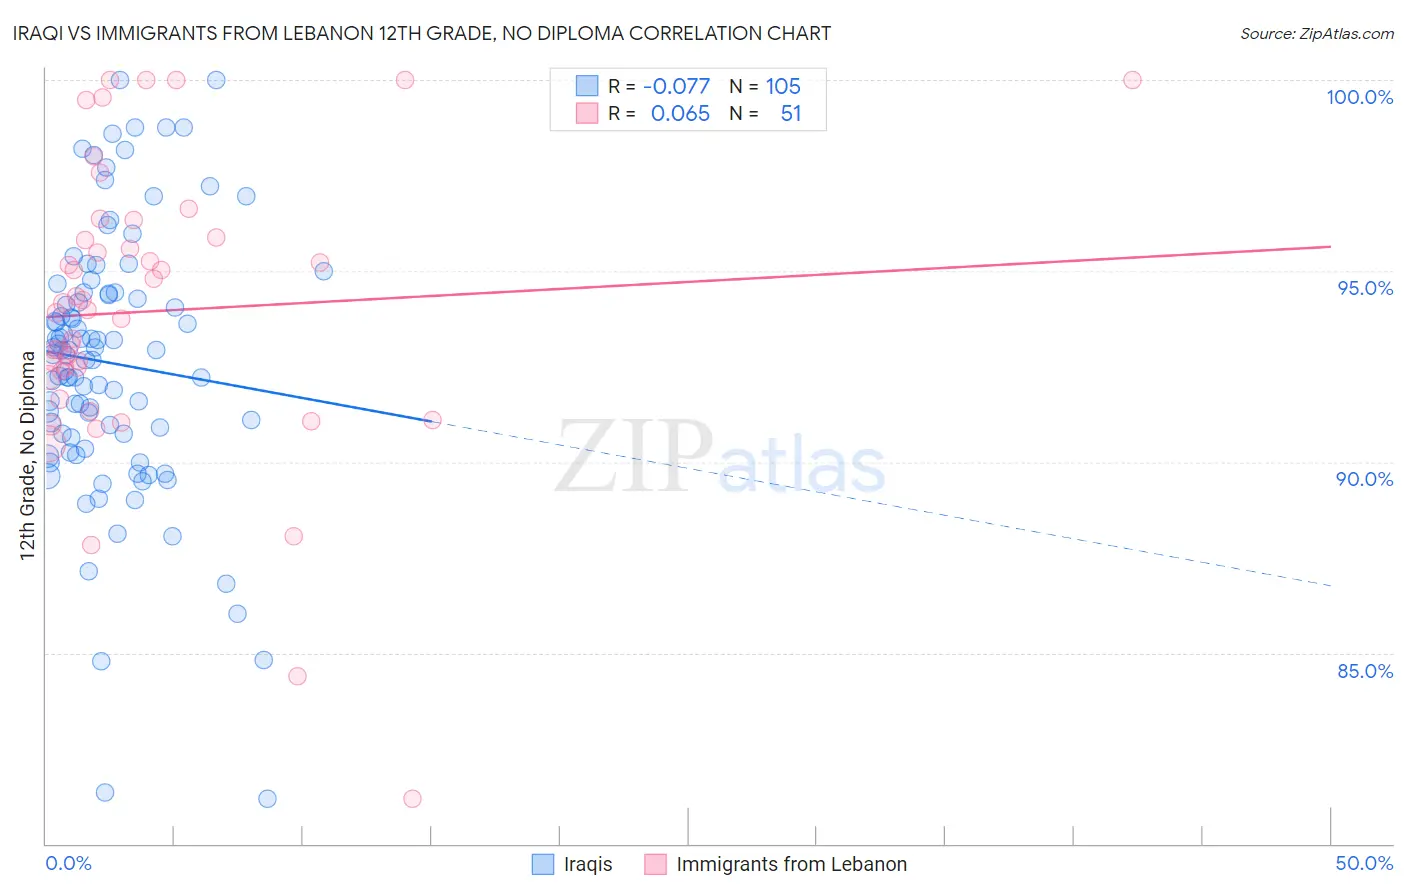
Iraqi vs Immigrants from Lebanon 12th Grade, No Diploma Correlation Chart
The statistical analysis conducted on geographies consisting of 170,614,457 people shows a slight negative correlation between the proportion of Iraqis and percentage of population with at least 12th grade (no diploma) education in the United States with a correlation coefficient (R) of -0.077 and weighted average of 91.5%. Similarly, the statistical analysis conducted on geographies consisting of 217,083,357 people shows a slight positive correlation between the proportion of Immigrants from Lebanon and percentage of population with at least 12th grade (no diploma) education in the United States with a correlation coefficient (R) of 0.065 and weighted average of 91.6%, a difference of 0.080%.
12th Grade, No Diploma Correlation Summary
| Measurement | Iraqi | Immigrants from Lebanon |
| Minimum | 81.2% | 81.2% |
| Maximum | 100.0% | 100.0% |
| Range | 18.8% | 18.8% |
| Mean | 92.6% | 93.9% |
| Median | 92.8% | 94.0% |
| Interquartile 25% (IQ1) | 90.7% | 92.2% |
| Interquartile 75% (IQ3) | 94.4% | 95.9% |
| Interquartile Range (IQR) | 3.7% | 3.7% |
| Standard Deviation (Sample) | 3.5% | 3.8% |
| Standard Deviation (Population) | 3.5% | 3.8% |
Demographics Similar to Iraqis and Immigrants from Lebanon by 12th Grade, No Diploma
In terms of 12th grade, no diploma, the demographic groups most similar to Iraqis are Immigrants from Kenya (91.5%, a difference of 0.020%), Kenyan (91.5%, a difference of 0.030%), Immigrants from Iraq (91.4%, a difference of 0.040%), Asian (91.4%, a difference of 0.050%), and Ugandan (91.5%, a difference of 0.060%). Similarly, the demographic groups most similar to Immigrants from Lebanon are Immigrants from Spain (91.6%, a difference of 0.0%), Immigrants from Brazil (91.5%, a difference of 0.0%), Immigrants from Argentina (91.6%, a difference of 0.010%), Pakistani (91.5%, a difference of 0.010%), and Indian (Asian) (91.5%, a difference of 0.010%).
| Demographics | Rating | Rank | 12th Grade, No Diploma |
| Immigrants | Egypt | 83.9 /100 | #139 | Excellent 91.6% |
| Immigrants | Poland | 82.3 /100 | #140 | Excellent 91.6% |
| Argentineans | 82.0 /100 | #141 | Excellent 91.6% |
| Immigrants | Venezuela | 80.9 /100 | #142 | Excellent 91.6% |
| Immigrants | Argentina | 80.7 /100 | #143 | Excellent 91.6% |
| Immigrants | Spain | 80.1 /100 | #144 | Excellent 91.6% |
| Immigrants | Lebanon | 80.0 /100 | #145 | Excellent 91.6% |
| Immigrants | Brazil | 79.8 /100 | #146 | Good 91.5% |
| Pakistanis | 79.6 /100 | #147 | Good 91.5% |
| Indians (Asian) | 79.4 /100 | #148 | Good 91.5% |
| Ugandans | 79.0 /100 | #149 | Good 91.5% |
| Paraguayans | 78.9 /100 | #150 | Good 91.5% |
| Chippewa | 78.8 /100 | #151 | Good 91.5% |
| Kenyans | 77.4 /100 | #152 | Good 91.5% |
| Iraqis | 75.3 /100 | #153 | Good 91.5% |
| Immigrants | Kenya | 73.9 /100 | #154 | Good 91.5% |
| Immigrants | Iraq | 73.0 /100 | #155 | Good 91.4% |
| Asians | 71.9 /100 | #156 | Good 91.4% |
| Immigrants | Pakistan | 70.7 /100 | #157 | Good 91.4% |
| Immigrants | Northern Africa | 66.2 /100 | #158 | Good 91.4% |
| Laotians | 64.4 /100 | #159 | Good 91.3% |