Iraqi vs Immigrants from Latvia 6th Grade
COMPARE
Iraqi
Immigrants from Latvia
6th Grade
6th Grade Comparison
Iraqis
Immigrants from Latvia
96.8%
6TH GRADE
11.7/ 100
METRIC RATING
207th/ 347
METRIC RANK
97.4%
6TH GRADE
96.7/ 100
METRIC RATING
112th/ 347
METRIC RANK
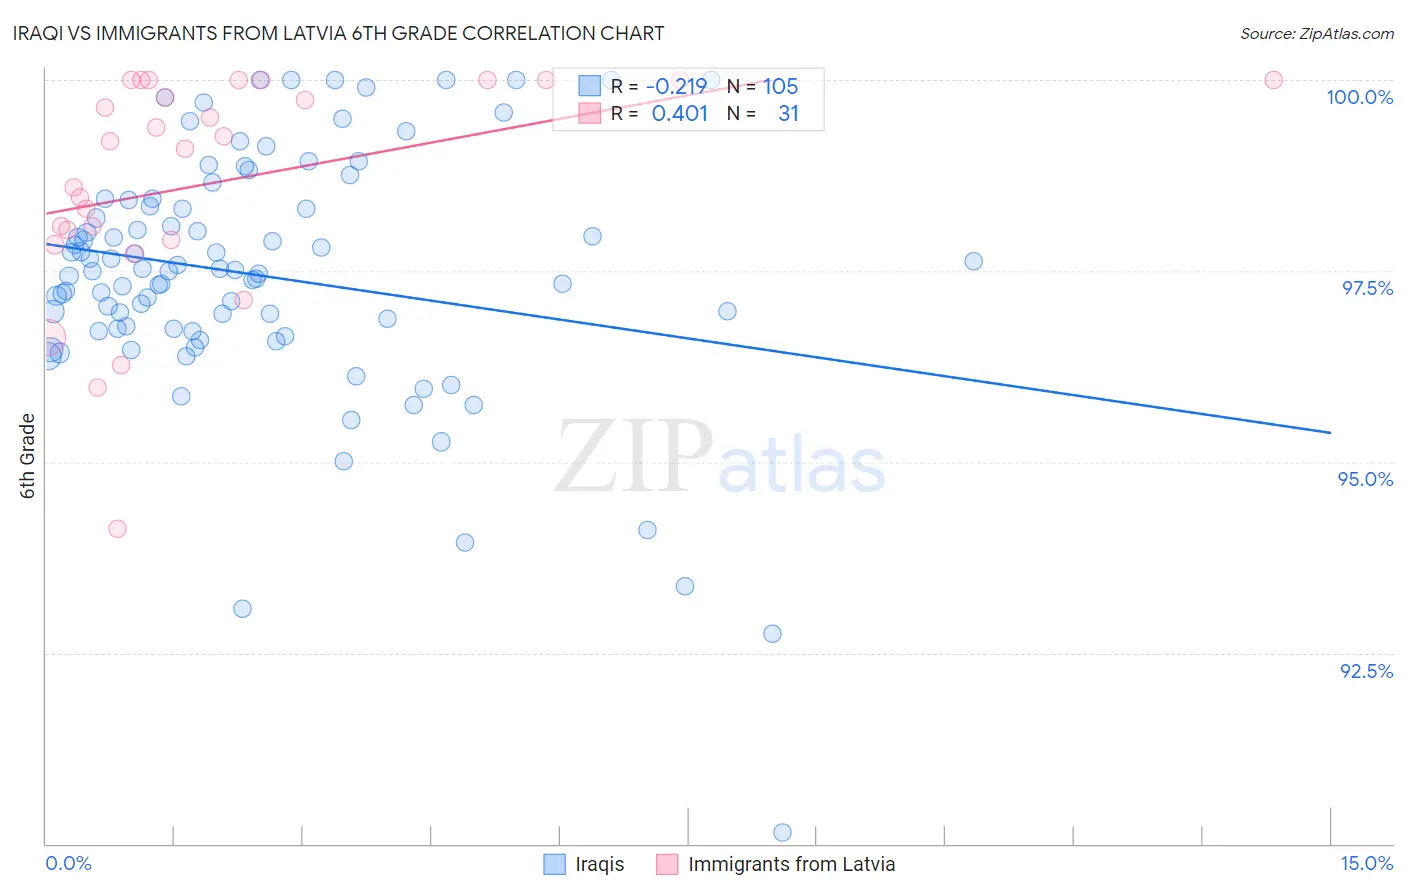
Iraqi vs Immigrants from Latvia 6th Grade Correlation Chart
The statistical analysis conducted on geographies consisting of 170,614,457 people shows a weak negative correlation between the proportion of Iraqis and percentage of population with at least 6th grade education in the United States with a correlation coefficient (R) of -0.219 and weighted average of 96.8%. Similarly, the statistical analysis conducted on geographies consisting of 113,735,345 people shows a moderate positive correlation between the proportion of Immigrants from Latvia and percentage of population with at least 6th grade education in the United States with a correlation coefficient (R) of 0.401 and weighted average of 97.4%, a difference of 0.62%.
6th Grade Correlation Summary
| Measurement | Iraqi | Immigrants from Latvia |
| Minimum | 90.1% | 94.1% |
| Maximum | 100.0% | 100.0% |
| Range | 9.9% | 5.9% |
| Mean | 97.4% | 98.7% |
| Median | 97.5% | 99.2% |
| Interquartile 25% (IQ1) | 96.7% | 97.9% |
| Interquartile 75% (IQ3) | 98.4% | 100.0% |
| Interquartile Range (IQR) | 1.7% | 2.1% |
| Standard Deviation (Sample) | 1.7% | 1.5% |
| Standard Deviation (Population) | 1.6% | 1.4% |
Similar Demographics by 6th Grade
Demographics Similar to Iraqis by 6th Grade
In terms of 6th grade, the demographic groups most similar to Iraqis are Laotian (96.8%, a difference of 0.0%), Native/Alaskan (96.8%, a difference of 0.010%), Samoan (96.8%, a difference of 0.010%), Immigrants from Oceania (96.8%, a difference of 0.010%), and Immigrants from Chile (96.8%, a difference of 0.020%).
| Demographics | Rating | Rank | 6th Grade |
| Africans | 14.8 /100 | #200 | Poor 96.9% |
| Immigrants | Zaire | 14.5 /100 | #201 | Poor 96.9% |
| Immigrants | Chile | 14.2 /100 | #202 | Poor 96.8% |
| Sudanese | 13.9 /100 | #203 | Poor 96.8% |
| Immigrants | Bahamas | 13.8 /100 | #204 | Poor 96.8% |
| Natives/Alaskans | 13.0 /100 | #205 | Poor 96.8% |
| Laotians | 11.8 /100 | #206 | Poor 96.8% |
| Iraqis | 11.7 /100 | #207 | Poor 96.8% |
| Samoans | 11.0 /100 | #208 | Poor 96.8% |
| Immigrants | Oceania | 11.0 /100 | #209 | Poor 96.8% |
| Immigrants | Nepal | 10.1 /100 | #210 | Poor 96.8% |
| Immigrants | Iraq | 9.2 /100 | #211 | Tragic 96.8% |
| Moroccans | 9.0 /100 | #212 | Tragic 96.8% |
| Immigrants | Sudan | 8.7 /100 | #213 | Tragic 96.8% |
| Portuguese | 8.2 /100 | #214 | Tragic 96.8% |
Demographics Similar to Immigrants from Latvia by 6th Grade
In terms of 6th grade, the demographic groups most similar to Immigrants from Latvia are Thai (97.4%, a difference of 0.010%), Iroquois (97.4%, a difference of 0.010%), Immigrants from Saudi Arabia (97.4%, a difference of 0.010%), Colville (97.4%, a difference of 0.010%), and Nonimmigrants (97.4%, a difference of 0.020%).
| Demographics | Rating | Rank | 6th Grade |
| Cheyenne | 97.9 /100 | #105 | Exceptional 97.5% |
| Menominee | 97.7 /100 | #106 | Exceptional 97.5% |
| Immigrants | Singapore | 97.6 /100 | #107 | Exceptional 97.5% |
| Immigrants | Nonimmigrants | 97.3 /100 | #108 | Exceptional 97.4% |
| Immigrants | Czechoslovakia | 97.3 /100 | #109 | Exceptional 97.4% |
| Thais | 96.9 /100 | #110 | Exceptional 97.4% |
| Iroquois | 96.9 /100 | #111 | Exceptional 97.4% |
| Immigrants | Latvia | 96.7 /100 | #112 | Exceptional 97.4% |
| Immigrants | Saudi Arabia | 96.5 /100 | #113 | Exceptional 97.4% |
| Colville | 96.4 /100 | #114 | Exceptional 97.4% |
| Immigrants | Switzerland | 95.7 /100 | #115 | Exceptional 97.4% |
| Lebanese | 95.5 /100 | #116 | Exceptional 97.4% |
| Basques | 95.4 /100 | #117 | Exceptional 97.4% |
| Immigrants | Japan | 95.2 /100 | #118 | Exceptional 97.4% |
| Immigrants | Zimbabwe | 95.0 /100 | #119 | Exceptional 97.4% |