Indonesian vs Subsaharan African 11th Grade
COMPARE
Indonesian
Subsaharan African
11th Grade
11th Grade Comparison
Indonesians
Sub-Saharan Africans
90.3%
11TH GRADE
0.0/ 100
METRIC RATING
290th/ 347
METRIC RANK
91.7%
11TH GRADE
2.9/ 100
METRIC RATING
235th/ 347
METRIC RANK
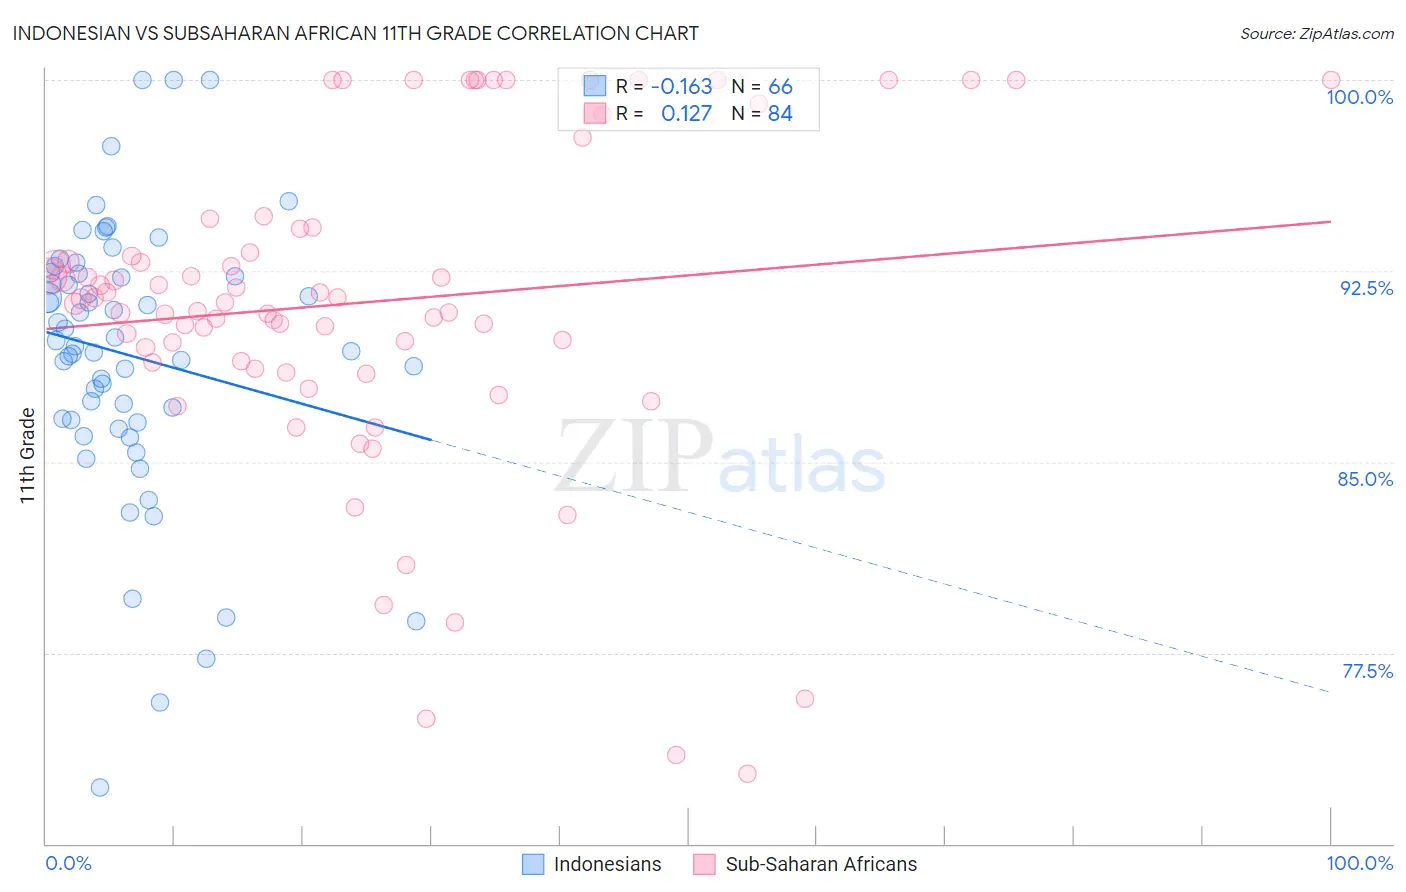
Indonesian vs Subsaharan African 11th Grade Correlation Chart
The statistical analysis conducted on geographies consisting of 162,727,113 people shows a poor negative correlation between the proportion of Indonesians and percentage of population with at least 11th grade education in the United States with a correlation coefficient (R) of -0.163 and weighted average of 90.3%. Similarly, the statistical analysis conducted on geographies consisting of 508,219,008 people shows a poor positive correlation between the proportion of Sub-Saharan Africans and percentage of population with at least 11th grade education in the United States with a correlation coefficient (R) of 0.127 and weighted average of 91.7%, a difference of 1.6%.
11th Grade Correlation Summary
| Measurement | Indonesian | Subsaharan African |
| Minimum | 72.2% | 72.7% |
| Maximum | 100.0% | 100.0% |
| Range | 27.8% | 27.3% |
| Mean | 89.2% | 91.3% |
| Median | 89.7% | 91.3% |
| Interquartile 25% (IQ1) | 86.6% | 88.9% |
| Interquartile 75% (IQ3) | 92.4% | 94.2% |
| Interquartile Range (IQR) | 5.8% | 5.3% |
| Standard Deviation (Sample) | 5.4% | 6.3% |
| Standard Deviation (Population) | 5.4% | 6.3% |
Similar Demographics by 11th Grade
Demographics Similar to Indonesians by 11th Grade
In terms of 11th grade, the demographic groups most similar to Indonesians are British West Indian (90.3%, a difference of 0.020%), Haitian (90.3%, a difference of 0.040%), Pennsylvania German (90.3%, a difference of 0.050%), Apache (90.4%, a difference of 0.070%), and Cuban (90.2%, a difference of 0.070%).
| Demographics | Rating | Rank | 11th Grade |
| Immigrants | Barbados | 0.0 /100 | #283 | Tragic 90.7% |
| Immigrants | Laos | 0.0 /100 | #284 | Tragic 90.5% |
| Immigrants | Burma/Myanmar | 0.0 /100 | #285 | Tragic 90.4% |
| Immigrants | West Indies | 0.0 /100 | #286 | Tragic 90.4% |
| Apache | 0.0 /100 | #287 | Tragic 90.4% |
| Pennsylvania Germans | 0.0 /100 | #288 | Tragic 90.3% |
| British West Indians | 0.0 /100 | #289 | Tragic 90.3% |
| Indonesians | 0.0 /100 | #290 | Tragic 90.3% |
| Haitians | 0.0 /100 | #291 | Tragic 90.3% |
| Cubans | 0.0 /100 | #292 | Tragic 90.2% |
| Natives/Alaskans | 0.0 /100 | #293 | Tragic 90.2% |
| Immigrants | Grenada | 0.0 /100 | #294 | Tragic 90.1% |
| Immigrants | Vietnam | 0.0 /100 | #295 | Tragic 90.0% |
| Fijians | 0.0 /100 | #296 | Tragic 90.0% |
| Navajo | 0.0 /100 | #297 | Tragic 90.0% |
Demographics Similar to Sub-Saharan Africans by 11th Grade
In terms of 11th grade, the demographic groups most similar to Sub-Saharan Africans are Armenian (91.7%, a difference of 0.0%), Colombian (91.7%, a difference of 0.0%), Immigrants from Bolivia (91.7%, a difference of 0.0%), Cheyenne (91.8%, a difference of 0.030%), and Comanche (91.7%, a difference of 0.030%).
| Demographics | Rating | Rank | 11th Grade |
| Immigrants | Panama | 4.3 /100 | #228 | Tragic 91.8% |
| Nigerians | 4.3 /100 | #229 | Tragic 91.8% |
| Immigrants | Afghanistan | 3.9 /100 | #230 | Tragic 91.8% |
| Choctaw | 3.7 /100 | #231 | Tragic 91.8% |
| Uruguayans | 3.5 /100 | #232 | Tragic 91.8% |
| Cheyenne | 3.3 /100 | #233 | Tragic 91.8% |
| Armenians | 2.9 /100 | #234 | Tragic 91.7% |
| Sub-Saharan Africans | 2.9 /100 | #235 | Tragic 91.7% |
| Colombians | 2.8 /100 | #236 | Tragic 91.7% |
| Immigrants | Bolivia | 2.8 /100 | #237 | Tragic 91.7% |
| Comanche | 2.6 /100 | #238 | Tragic 91.7% |
| Hopi | 2.5 /100 | #239 | Tragic 91.7% |
| South Americans | 2.0 /100 | #240 | Tragic 91.6% |
| Bahamians | 1.8 /100 | #241 | Tragic 91.6% |
| Immigrants | Middle Africa | 1.6 /100 | #242 | Tragic 91.6% |