Indonesian vs Immigrants from Laos 12th Grade, No Diploma
COMPARE
Indonesian
Immigrants from Laos
12th Grade, No Diploma
12th Grade, No Diploma Comparison
Indonesians
Immigrants from Laos
88.6%
12TH GRADE, NO DIPLOMA
0.0/ 100
METRIC RATING
285th/ 347
METRIC RANK
88.9%
12TH GRADE, NO DIPLOMA
0.0/ 100
METRIC RATING
279th/ 347
METRIC RANK
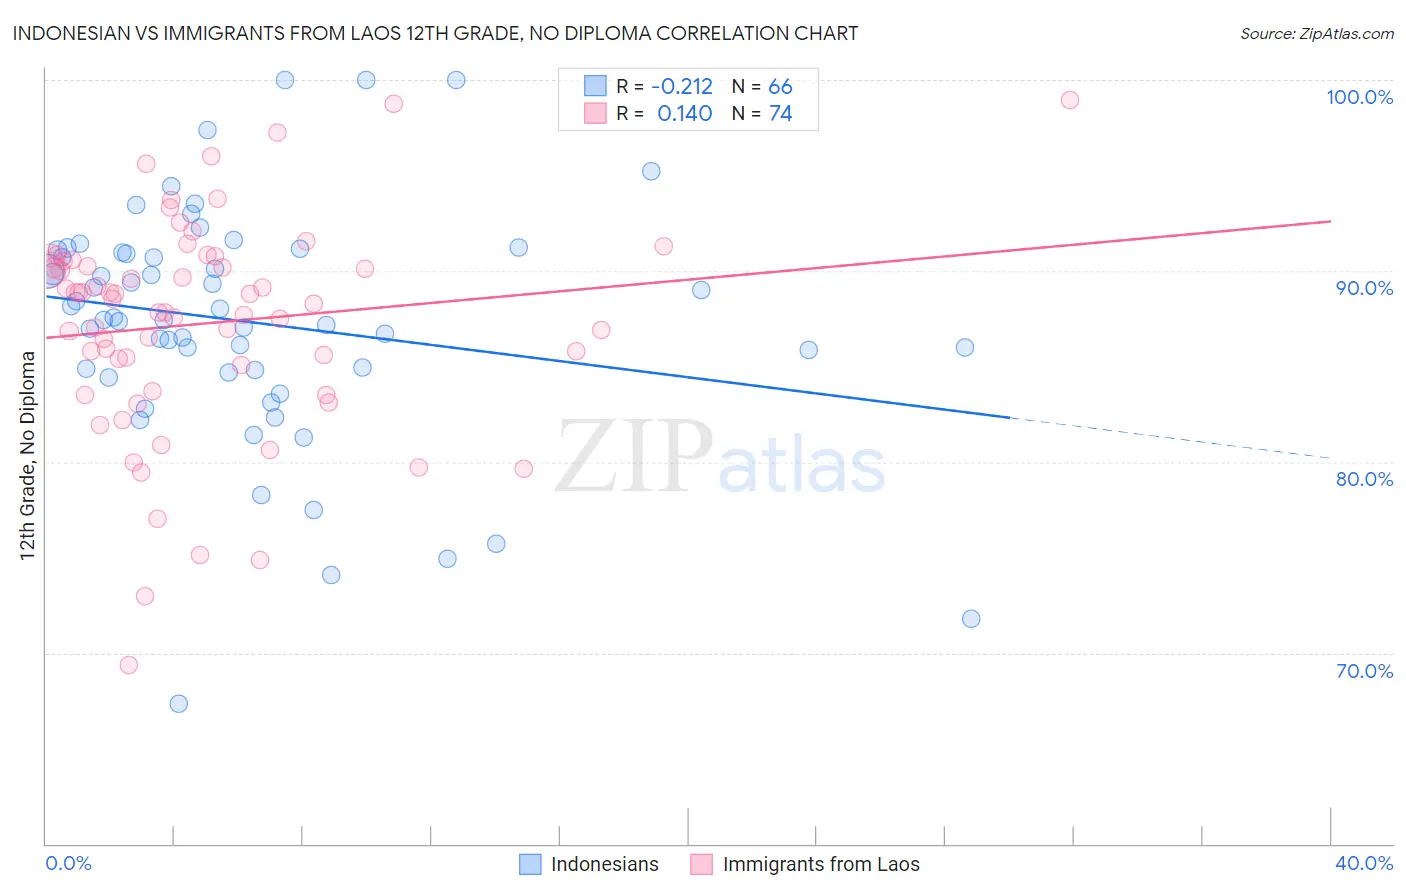
Indonesian vs Immigrants from Laos 12th Grade, No Diploma Correlation Chart
The statistical analysis conducted on geographies consisting of 162,727,113 people shows a weak negative correlation between the proportion of Indonesians and percentage of population with at least 12th grade (no diploma) education in the United States with a correlation coefficient (R) of -0.212 and weighted average of 88.6%. Similarly, the statistical analysis conducted on geographies consisting of 201,472,886 people shows a poor positive correlation between the proportion of Immigrants from Laos and percentage of population with at least 12th grade (no diploma) education in the United States with a correlation coefficient (R) of 0.140 and weighted average of 88.9%, a difference of 0.26%.
12th Grade, No Diploma Correlation Summary
| Measurement | Indonesian | Immigrants from Laos |
| Minimum | 67.3% | 69.3% |
| Maximum | 100.0% | 98.9% |
| Range | 32.7% | 29.6% |
| Mean | 87.3% | 87.3% |
| Median | 87.5% | 88.4% |
| Interquartile 25% (IQ1) | 84.8% | 85.1% |
| Interquartile 75% (IQ3) | 91.0% | 90.5% |
| Interquartile Range (IQR) | 6.1% | 5.4% |
| Standard Deviation (Sample) | 6.2% | 5.6% |
| Standard Deviation (Population) | 6.2% | 5.6% |
Demographics Similar to Indonesians and Immigrants from Laos by 12th Grade, No Diploma
In terms of 12th grade, no diploma, the demographic groups most similar to Indonesians are Immigrants from West Indies (88.6%, a difference of 0.0%), Hopi (88.6%, a difference of 0.010%), Immigrants from Fiji (88.6%, a difference of 0.010%), Pennsylvania German (88.7%, a difference of 0.020%), and Paiute (88.7%, a difference of 0.030%). Similarly, the demographic groups most similar to Immigrants from Laos are Immigrants from Burma/Myanmar (88.9%, a difference of 0.0%), Cuban (88.9%, a difference of 0.010%), Immigrants from St. Vincent and the Grenadines (88.9%, a difference of 0.070%), Immigrants from Barbados (89.0%, a difference of 0.13%), and Immigrants from Vietnam (88.7%, a difference of 0.18%).
| Demographics | Rating | Rank | 12th Grade, No Diploma |
| Malaysians | 0.1 /100 | #272 | Tragic 89.2% |
| Barbadians | 0.1 /100 | #273 | Tragic 89.1% |
| Cajuns | 0.1 /100 | #274 | Tragic 89.1% |
| Immigrants | Congo | 0.1 /100 | #275 | Tragic 89.0% |
| Ute | 0.1 /100 | #276 | Tragic 89.0% |
| Immigrants | Barbados | 0.0 /100 | #277 | Tragic 89.0% |
| Immigrants | St. Vincent and the Grenadines | 0.0 /100 | #278 | Tragic 88.9% |
| Immigrants | Laos | 0.0 /100 | #279 | Tragic 88.9% |
| Immigrants | Burma/Myanmar | 0.0 /100 | #280 | Tragic 88.9% |
| Cubans | 0.0 /100 | #281 | Tragic 88.9% |
| Immigrants | Vietnam | 0.0 /100 | #282 | Tragic 88.7% |
| Paiute | 0.0 /100 | #283 | Tragic 88.7% |
| Pennsylvania Germans | 0.0 /100 | #284 | Tragic 88.7% |
| Indonesians | 0.0 /100 | #285 | Tragic 88.6% |
| Immigrants | West Indies | 0.0 /100 | #286 | Tragic 88.6% |
| Hopi | 0.0 /100 | #287 | Tragic 88.6% |
| Immigrants | Fiji | 0.0 /100 | #288 | Tragic 88.6% |
| Dutch West Indians | 0.0 /100 | #289 | Tragic 88.5% |
| British West Indians | 0.0 /100 | #290 | Tragic 88.5% |
| Haitians | 0.0 /100 | #291 | Tragic 88.5% |
| Immigrants | Grenada | 0.0 /100 | #292 | Tragic 88.4% |