Immigrants vs Cypriot 4th Grade
COMPARE
Immigrants
Cypriot
4th Grade
4th Grade Comparison
Immigrants
Cypriots
96.5%
4TH GRADE
0.0/ 100
METRIC RATING
301st/ 347
METRIC RANK
97.9%
4TH GRADE
98.9/ 100
METRIC RATING
84th/ 347
METRIC RANK
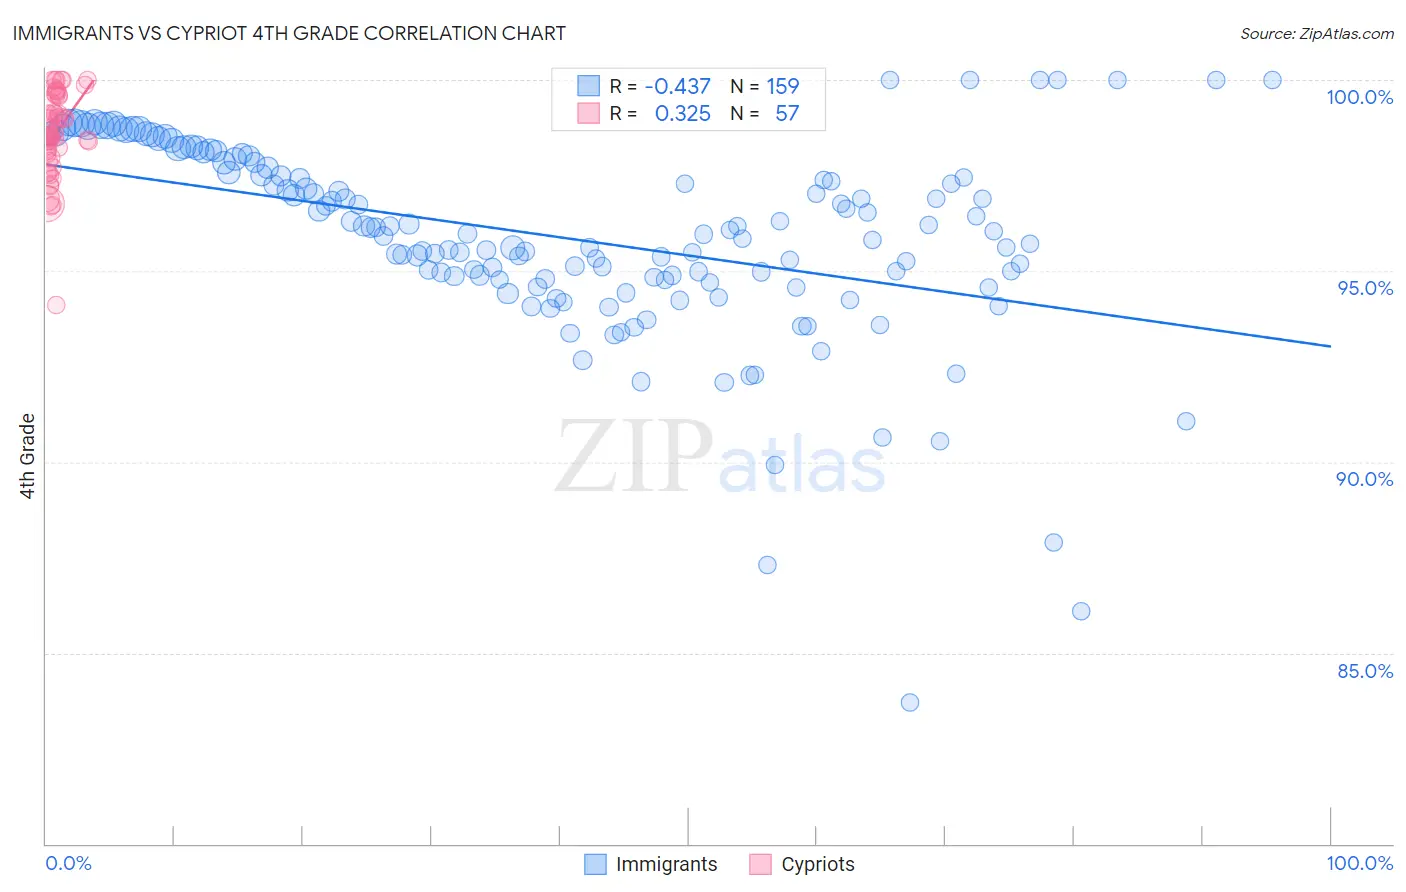
Immigrants vs Cypriot 4th Grade Correlation Chart
The statistical analysis conducted on geographies consisting of 577,786,979 people shows a moderate negative correlation between the proportion of Immigrants and percentage of population with at least 4th grade education in the United States with a correlation coefficient (R) of -0.437 and weighted average of 96.5%. Similarly, the statistical analysis conducted on geographies consisting of 61,870,289 people shows a mild positive correlation between the proportion of Cypriots and percentage of population with at least 4th grade education in the United States with a correlation coefficient (R) of 0.325 and weighted average of 97.9%, a difference of 1.5%.
4th Grade Correlation Summary
| Measurement | Immigrants | Cypriot |
| Minimum | 83.7% | 94.1% |
| Maximum | 100.0% | 100.0% |
| Range | 16.3% | 5.9% |
| Mean | 95.9% | 98.6% |
| Median | 96.0% | 98.6% |
| Interquartile 25% (IQ1) | 94.8% | 98.0% |
| Interquartile 75% (IQ3) | 97.7% | 99.6% |
| Interquartile Range (IQR) | 2.9% | 1.6% |
| Standard Deviation (Sample) | 2.6% | 1.1% |
| Standard Deviation (Population) | 2.6% | 1.1% |
Similar Demographics by 4th Grade
Demographics Similar to Immigrants by 4th Grade
In terms of 4th grade, the demographic groups most similar to Immigrants are Immigrants from Cuba (96.4%, a difference of 0.030%), Immigrants from Dominica (96.5%, a difference of 0.050%), Immigrants from South Eastern Asia (96.5%, a difference of 0.050%), Haitian (96.5%, a difference of 0.060%), and Immigrants from Somalia (96.5%, a difference of 0.080%).
| Demographics | Rating | Rank | 4th Grade |
| Immigrants | Eritrea | 0.0 /100 | #294 | Tragic 96.7% |
| Immigrants | Portugal | 0.0 /100 | #295 | Tragic 96.6% |
| Somalis | 0.0 /100 | #296 | Tragic 96.6% |
| Immigrants | Somalia | 0.0 /100 | #297 | Tragic 96.5% |
| Haitians | 0.0 /100 | #298 | Tragic 96.5% |
| Immigrants | Dominica | 0.0 /100 | #299 | Tragic 96.5% |
| Immigrants | South Eastern Asia | 0.0 /100 | #300 | Tragic 96.5% |
| Immigrants | Immigrants | 0.0 /100 | #301 | Tragic 96.5% |
| Immigrants | Cuba | 0.0 /100 | #302 | Tragic 96.4% |
| Guyanese | 0.0 /100 | #303 | Tragic 96.4% |
| Ecuadorians | 0.0 /100 | #304 | Tragic 96.4% |
| Immigrants | Caribbean | 0.0 /100 | #305 | Tragic 96.4% |
| Sri Lankans | 0.0 /100 | #306 | Tragic 96.4% |
| Immigrants | Haiti | 0.0 /100 | #307 | Tragic 96.3% |
| Immigrants | Laos | 0.0 /100 | #308 | Tragic 96.3% |
Demographics Similar to Cypriots by 4th Grade
In terms of 4th grade, the demographic groups most similar to Cypriots are Potawatomi (97.9%, a difference of 0.0%), Immigrants from Australia (97.9%, a difference of 0.0%), Immigrants from Belgium (97.9%, a difference of 0.010%), Zimbabwean (97.9%, a difference of 0.010%), and Immigrants from South Africa (97.9%, a difference of 0.010%).
| Demographics | Rating | Rank | 4th Grade |
| Immigrants | Lithuania | 99.3 /100 | #77 | Exceptional 98.0% |
| Immigrants | England | 99.3 /100 | #78 | Exceptional 98.0% |
| Ukrainians | 99.2 /100 | #79 | Exceptional 98.0% |
| Osage | 99.2 /100 | #80 | Exceptional 98.0% |
| Immigrants | India | 99.1 /100 | #81 | Exceptional 98.0% |
| Icelanders | 99.1 /100 | #82 | Exceptional 98.0% |
| Immigrants | Belgium | 99.0 /100 | #83 | Exceptional 97.9% |
| Cypriots | 98.9 /100 | #84 | Exceptional 97.9% |
| Potawatomi | 98.9 /100 | #85 | Exceptional 97.9% |
| Immigrants | Australia | 98.8 /100 | #86 | Exceptional 97.9% |
| Zimbabweans | 98.8 /100 | #87 | Exceptional 97.9% |
| Immigrants | South Africa | 98.8 /100 | #88 | Exceptional 97.9% |
| Delaware | 98.8 /100 | #89 | Exceptional 97.9% |
| Immigrants | Denmark | 98.7 /100 | #90 | Exceptional 97.9% |
| Immigrants | Sweden | 98.7 /100 | #91 | Exceptional 97.9% |