Immigrants from Zimbabwe vs Potawatomi 1st Grade
COMPARE
Immigrants from Zimbabwe
Potawatomi
1st Grade
1st Grade Comparison
Immigrants from Zimbabwe
Potawatomi
98.1%
1ST GRADE
94.0/ 100
METRIC RATING
121st/ 347
METRIC RANK
98.3%
1ST GRADE
99.1/ 100
METRIC RATING
81st/ 347
METRIC RANK
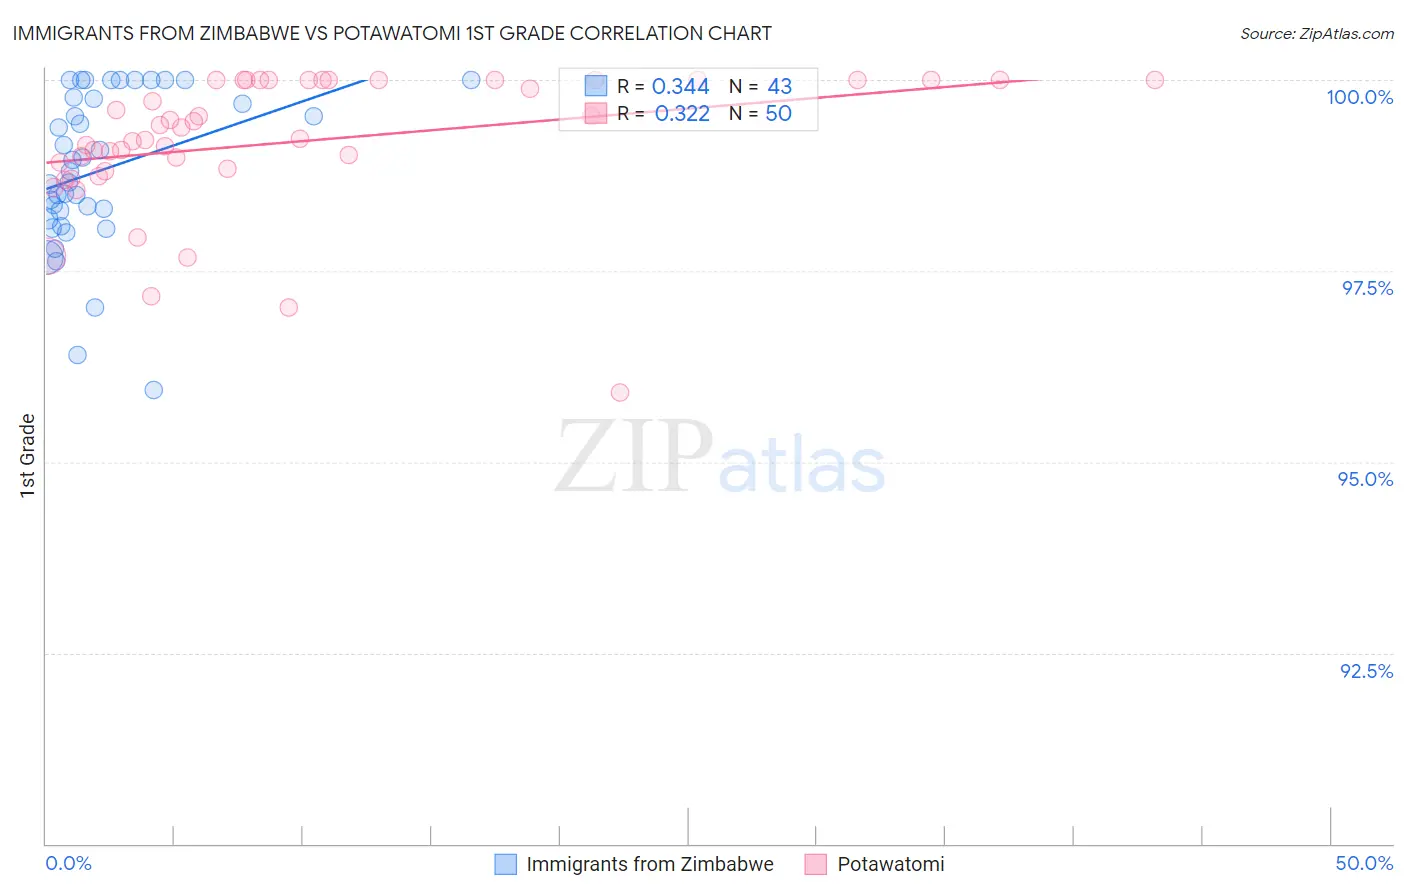
Immigrants from Zimbabwe vs Potawatomi 1st Grade Correlation Chart
The statistical analysis conducted on geographies consisting of 117,756,150 people shows a mild positive correlation between the proportion of Immigrants from Zimbabwe and percentage of population with at least 1st grade education in the United States with a correlation coefficient (R) of 0.344 and weighted average of 98.1%. Similarly, the statistical analysis conducted on geographies consisting of 117,769,196 people shows a mild positive correlation between the proportion of Potawatomi and percentage of population with at least 1st grade education in the United States with a correlation coefficient (R) of 0.322 and weighted average of 98.3%, a difference of 0.16%.
1st Grade Correlation Summary
| Measurement | Immigrants from Zimbabwe | Potawatomi |
| Minimum | 95.9% | 95.9% |
| Maximum | 100.0% | 100.0% |
| Range | 4.1% | 4.1% |
| Mean | 98.8% | 99.2% |
| Median | 98.8% | 99.3% |
| Interquartile 25% (IQ1) | 98.2% | 98.8% |
| Interquartile 75% (IQ3) | 99.8% | 100.0% |
| Interquartile Range (IQR) | 1.6% | 1.2% |
| Standard Deviation (Sample) | 1.0% | 0.90% |
| Standard Deviation (Population) | 1.0% | 0.89% |
Similar Demographics by 1st Grade
Demographics Similar to Immigrants from Zimbabwe by 1st Grade
In terms of 1st grade, the demographic groups most similar to Immigrants from Zimbabwe are Menominee (98.1%, a difference of 0.0%), Iroquois (98.1%, a difference of 0.0%), Syrian (98.1%, a difference of 0.0%), Immigrants from Japan (98.1%, a difference of 0.0%), and Thai (98.1%, a difference of 0.010%).
| Demographics | Rating | Rank | 1st Grade |
| Ute | 96.2 /100 | #114 | Exceptional 98.2% |
| Iranians | 96.0 /100 | #115 | Exceptional 98.2% |
| Spanish | 95.9 /100 | #116 | Exceptional 98.2% |
| Yugoslavians | 95.5 /100 | #117 | Exceptional 98.2% |
| Immigrants | France | 95.5 /100 | #118 | Exceptional 98.2% |
| Thais | 94.7 /100 | #119 | Exceptional 98.1% |
| Okinawans | 94.5 /100 | #120 | Exceptional 98.1% |
| Immigrants | Zimbabwe | 94.0 /100 | #121 | Exceptional 98.1% |
| Menominee | 93.9 /100 | #122 | Exceptional 98.1% |
| Iroquois | 93.8 /100 | #123 | Exceptional 98.1% |
| Syrians | 93.7 /100 | #124 | Exceptional 98.1% |
| Immigrants | Japan | 93.7 /100 | #125 | Exceptional 98.1% |
| Lebanese | 93.5 /100 | #126 | Exceptional 98.1% |
| Immigrants | Saudi Arabia | 93.3 /100 | #127 | Exceptional 98.1% |
| Immigrants | Serbia | 92.2 /100 | #128 | Exceptional 98.1% |
Demographics Similar to Potawatomi by 1st Grade
In terms of 1st grade, the demographic groups most similar to Potawatomi are Immigrants from Lithuania (98.3%, a difference of 0.0%), Osage (98.3%, a difference of 0.0%), Icelander (98.3%, a difference of 0.0%), Immigrants from Belgium (98.3%, a difference of 0.010%), and Immigrants from Sweden (98.3%, a difference of 0.010%).
| Demographics | Rating | Rank | 1st Grade |
| Immigrants | Netherlands | 99.4 /100 | #74 | Exceptional 98.3% |
| Cherokee | 99.3 /100 | #75 | Exceptional 98.3% |
| Shoshone | 99.3 /100 | #76 | Exceptional 98.3% |
| Immigrants | England | 99.3 /100 | #77 | Exceptional 98.3% |
| Immigrants | Belgium | 99.2 /100 | #78 | Exceptional 98.3% |
| Immigrants | Lithuania | 99.2 /100 | #79 | Exceptional 98.3% |
| Osage | 99.2 /100 | #80 | Exceptional 98.3% |
| Potawatomi | 99.1 /100 | #81 | Exceptional 98.3% |
| Icelanders | 99.1 /100 | #82 | Exceptional 98.3% |
| Immigrants | Sweden | 99.1 /100 | #83 | Exceptional 98.3% |
| Delaware | 99.1 /100 | #84 | Exceptional 98.3% |
| Hopi | 99.0 /100 | #85 | Exceptional 98.3% |
| Immigrants | Denmark | 99.0 /100 | #86 | Exceptional 98.3% |
| Immigrants | Australia | 99.0 /100 | #87 | Exceptional 98.3% |
| Zimbabweans | 98.9 /100 | #88 | Exceptional 98.3% |