Immigrants from Zaire vs Thai Nursery School
COMPARE
Immigrants from Zaire
Thai
Nursery School
Nursery School Comparison
Immigrants from Zaire
Thais
97.8%
NURSERY SCHOOL
4.4/ 100
METRIC RATING
220th/ 347
METRIC RANK
98.2%
NURSERY SCHOOL
95.0/ 100
METRIC RATING
119th/ 347
METRIC RANK
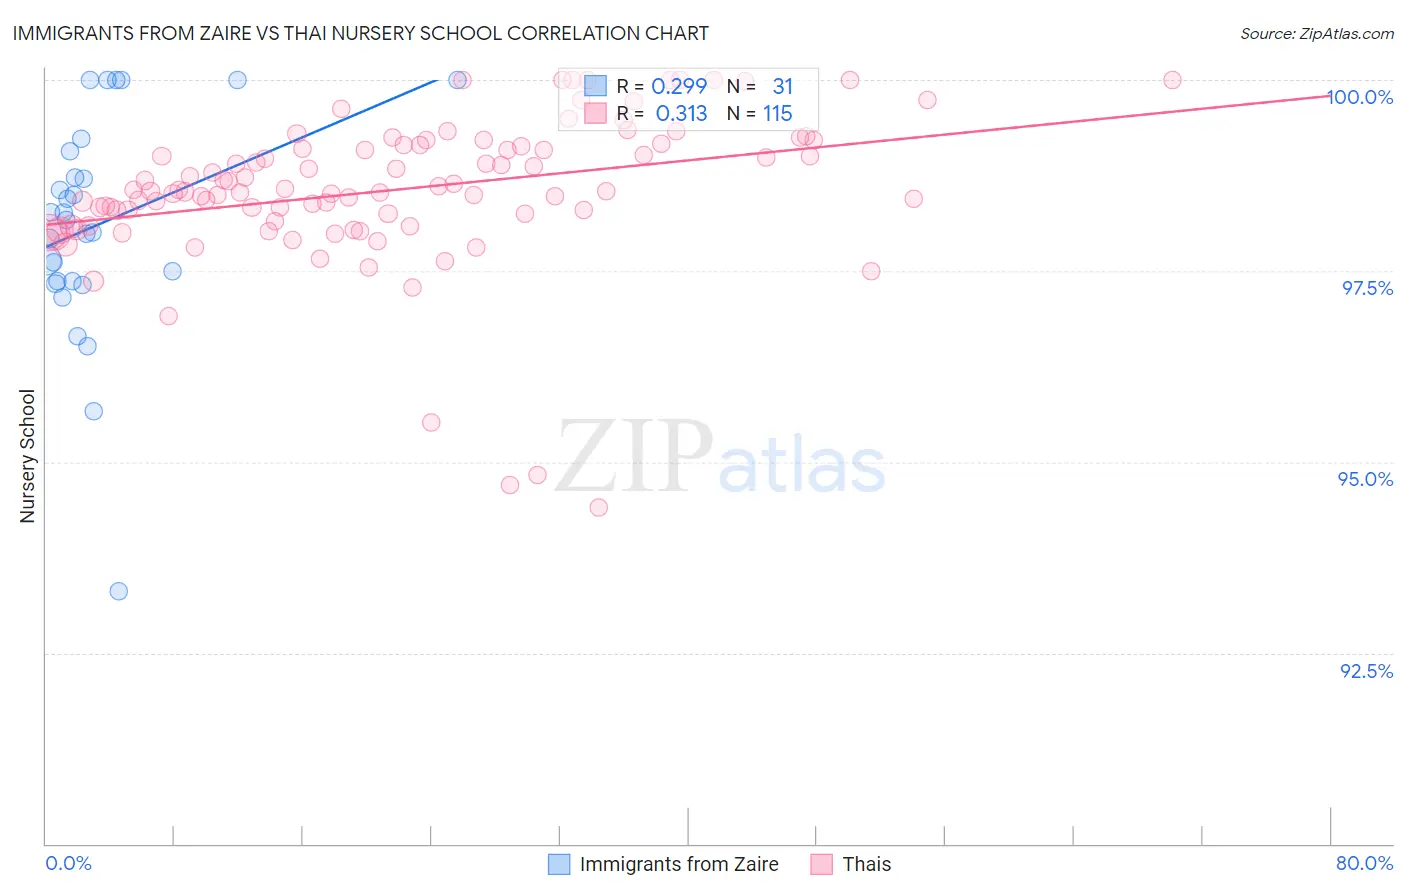
Immigrants from Zaire vs Thai Nursery School Correlation Chart
The statistical analysis conducted on geographies consisting of 107,250,996 people shows a weak positive correlation between the proportion of Immigrants from Zaire and percentage of population with at least nursery school education in the United States with a correlation coefficient (R) of 0.299 and weighted average of 97.8%. Similarly, the statistical analysis conducted on geographies consisting of 475,866,115 people shows a mild positive correlation between the proportion of Thais and percentage of population with at least nursery school education in the United States with a correlation coefficient (R) of 0.313 and weighted average of 98.2%, a difference of 0.45%.
Nursery School Correlation Summary
| Measurement | Immigrants from Zaire | Thai |
| Minimum | 93.3% | 94.4% |
| Maximum | 100.0% | 100.0% |
| Range | 6.7% | 5.6% |
| Mean | 98.1% | 98.6% |
| Median | 98.2% | 98.6% |
| Interquartile 25% (IQ1) | 97.4% | 98.2% |
| Interquartile 75% (IQ3) | 99.1% | 99.1% |
| Interquartile Range (IQR) | 1.7% | 0.99% |
| Standard Deviation (Sample) | 1.4% | 0.98% |
| Standard Deviation (Population) | 1.4% | 0.97% |
Similar Demographics by Nursery School
Demographics Similar to Immigrants from Zaire by Nursery School
In terms of nursery school, the demographic groups most similar to Immigrants from Zaire are Tongan (97.8%, a difference of 0.0%), Immigrants from Morocco (97.8%, a difference of 0.010%), Immigrants from Syria (97.7%, a difference of 0.010%), Immigrants from Sudan (97.7%, a difference of 0.010%), and Immigrants from Nepal (97.7%, a difference of 0.010%).
| Demographics | Rating | Rank | Nursery School |
| Moroccans | 8.3 /100 | #213 | Tragic 97.8% |
| South American Indians | 8.0 /100 | #214 | Tragic 97.8% |
| Bahamians | 7.4 /100 | #215 | Tragic 97.8% |
| Uruguayans | 7.1 /100 | #216 | Tragic 97.8% |
| Samoans | 6.3 /100 | #217 | Tragic 97.8% |
| Immigrants | Panama | 5.3 /100 | #218 | Tragic 97.8% |
| Immigrants | Morocco | 5.1 /100 | #219 | Tragic 97.8% |
| Immigrants | Zaire | 4.4 /100 | #220 | Tragic 97.8% |
| Tongans | 4.3 /100 | #221 | Tragic 97.8% |
| Immigrants | Syria | 4.0 /100 | #222 | Tragic 97.7% |
| Immigrants | Sudan | 3.9 /100 | #223 | Tragic 97.7% |
| Immigrants | Nepal | 3.6 /100 | #224 | Tragic 97.7% |
| Immigrants | Costa Rica | 3.5 /100 | #225 | Tragic 97.7% |
| Iraqis | 3.5 /100 | #226 | Tragic 97.7% |
| Sub-Saharan Africans | 3.2 /100 | #227 | Tragic 97.7% |
Demographics Similar to Thais by Nursery School
In terms of nursery school, the demographic groups most similar to Thais are Spanish (98.2%, a difference of 0.010%), Immigrants from France (98.2%, a difference of 0.010%), Yugoslavian (98.2%, a difference of 0.010%), Okinawan (98.2%, a difference of 0.010%), and Immigrants from Zimbabwe (98.2%, a difference of 0.010%).
| Demographics | Rating | Rank | Nursery School |
| Immigrants | Norway | 96.6 /100 | #112 | Exceptional 98.2% |
| Immigrants | Latvia | 96.4 /100 | #113 | Exceptional 98.2% |
| Ute | 96.4 /100 | #114 | Exceptional 98.2% |
| Iranians | 96.3 /100 | #115 | Exceptional 98.2% |
| Spanish | 95.8 /100 | #116 | Exceptional 98.2% |
| Immigrants | France | 95.6 /100 | #117 | Exceptional 98.2% |
| Yugoslavians | 95.4 /100 | #118 | Exceptional 98.2% |
| Thais | 95.0 /100 | #119 | Exceptional 98.2% |
| Okinawans | 94.5 /100 | #120 | Exceptional 98.2% |
| Immigrants | Zimbabwe | 94.2 /100 | #121 | Exceptional 98.2% |
| Immigrants | Japan | 94.0 /100 | #122 | Exceptional 98.2% |
| Syrians | 93.9 /100 | #123 | Exceptional 98.2% |
| Lebanese | 93.8 /100 | #124 | Exceptional 98.2% |
| Iroquois | 93.7 /100 | #125 | Exceptional 98.2% |
| Menominee | 93.6 /100 | #126 | Exceptional 98.2% |