Immigrants from Zaire vs Immigrants from Morocco 1st Grade
COMPARE
Immigrants from Zaire
Immigrants from Morocco
1st Grade
1st Grade Comparison
Immigrants from Zaire
Immigrants from Morocco
97.7%
1ST GRADE
4.1/ 100
METRIC RATING
223rd/ 347
METRIC RANK
97.7%
1ST GRADE
5.3/ 100
METRIC RATING
218th/ 347
METRIC RANK
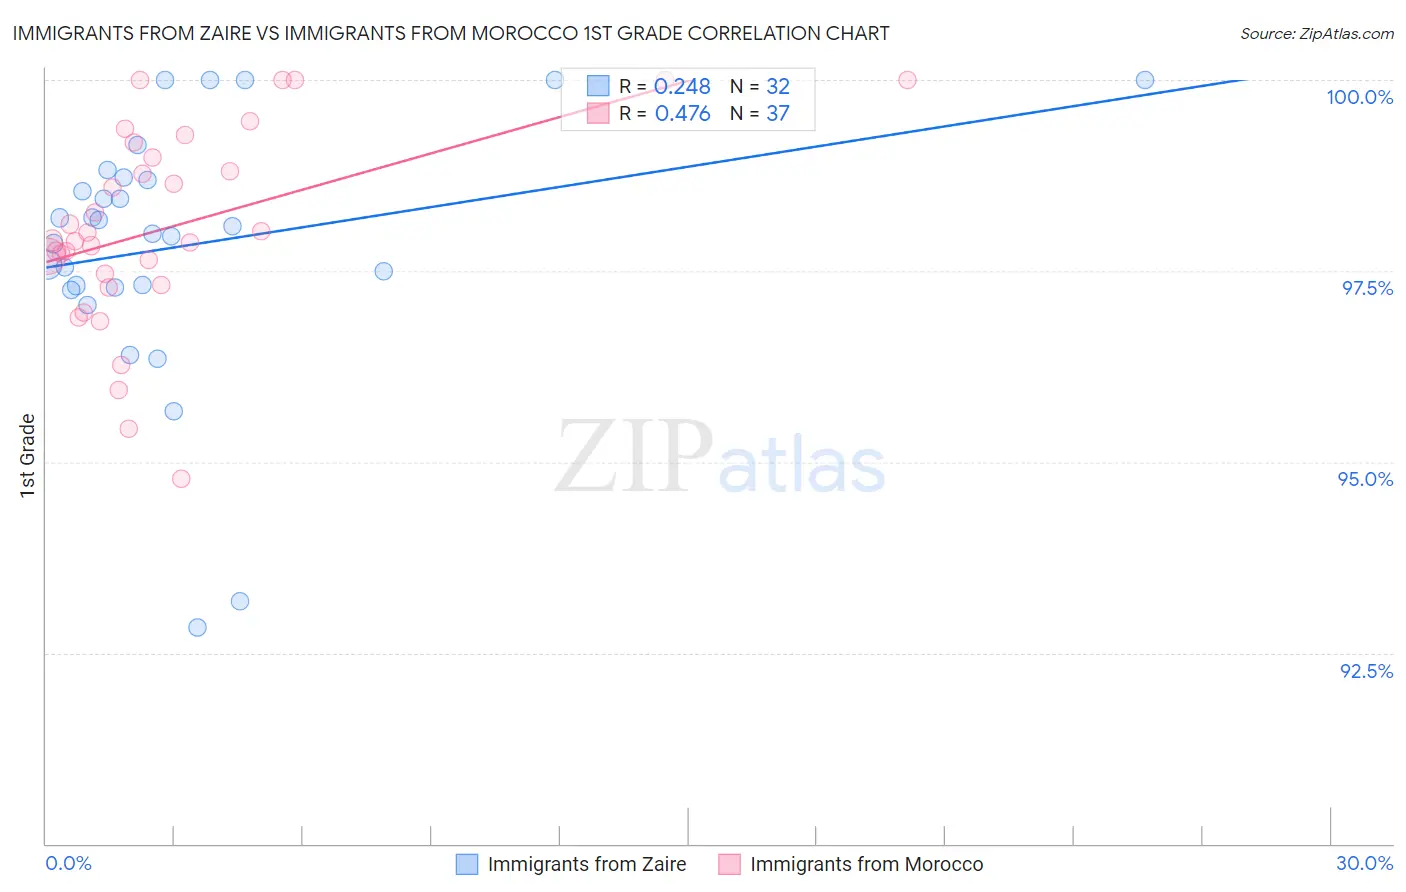
Immigrants from Zaire vs Immigrants from Morocco 1st Grade Correlation Chart
The statistical analysis conducted on geographies consisting of 107,255,805 people shows a weak positive correlation between the proportion of Immigrants from Zaire and percentage of population with at least 1st grade education in the United States with a correlation coefficient (R) of 0.248 and weighted average of 97.7%. Similarly, the statistical analysis conducted on geographies consisting of 178,912,438 people shows a moderate positive correlation between the proportion of Immigrants from Morocco and percentage of population with at least 1st grade education in the United States with a correlation coefficient (R) of 0.476 and weighted average of 97.7%, a difference of 0.020%.
1st Grade Correlation Summary
| Measurement | Immigrants from Zaire | Immigrants from Morocco |
| Minimum | 92.8% | 94.8% |
| Maximum | 100.0% | 100.0% |
| Range | 7.2% | 5.2% |
| Mean | 97.8% | 98.1% |
| Median | 98.0% | 97.9% |
| Interquartile 25% (IQ1) | 97.3% | 97.4% |
| Interquartile 75% (IQ3) | 98.7% | 99.1% |
| Interquartile Range (IQR) | 1.4% | 1.7% |
| Standard Deviation (Sample) | 1.7% | 1.3% |
| Standard Deviation (Population) | 1.7% | 1.3% |
Demographics Similar to Immigrants from Zaire and Immigrants from Morocco by 1st Grade
In terms of 1st grade, the demographic groups most similar to Immigrants from Zaire are Immigrants from Sudan (97.7%, a difference of 0.0%), Immigrants from Syria (97.7%, a difference of 0.0%), Iraqi (97.7%, a difference of 0.0%), Immigrants from Nepal (97.7%, a difference of 0.0%), and Tongan (97.7%, a difference of 0.010%). Similarly, the demographic groups most similar to Immigrants from Morocco are Immigrants from Panama (97.7%, a difference of 0.0%), Tongan (97.7%, a difference of 0.010%), Samoan (97.7%, a difference of 0.020%), Immigrants from Sudan (97.7%, a difference of 0.020%), and Immigrants from Syria (97.7%, a difference of 0.020%).
| Demographics | Rating | Rank | 1st Grade |
| Immigrants | Oceania | 11.0 /100 | #210 | Poor 97.8% |
| Laotians | 10.3 /100 | #211 | Poor 97.8% |
| Moroccans | 8.7 /100 | #212 | Tragic 97.7% |
| Immigrants | Bahamas | 8.1 /100 | #213 | Tragic 97.7% |
| South American Indians | 7.6 /100 | #214 | Tragic 97.7% |
| Bahamians | 7.5 /100 | #215 | Tragic 97.7% |
| Uruguayans | 7.4 /100 | #216 | Tragic 97.7% |
| Samoans | 6.8 /100 | #217 | Tragic 97.7% |
| Immigrants | Morocco | 5.3 /100 | #218 | Tragic 97.7% |
| Immigrants | Panama | 5.2 /100 | #219 | Tragic 97.7% |
| Tongans | 4.6 /100 | #220 | Tragic 97.7% |
| Immigrants | Sudan | 4.3 /100 | #221 | Tragic 97.7% |
| Immigrants | Syria | 4.2 /100 | #222 | Tragic 97.7% |
| Immigrants | Zaire | 4.1 /100 | #223 | Tragic 97.7% |
| Iraqis | 4.0 /100 | #224 | Tragic 97.7% |
| Immigrants | Nepal | 4.0 /100 | #225 | Tragic 97.7% |
| Sudanese | 3.7 /100 | #226 | Tragic 97.7% |
| Sierra Leoneans | 3.6 /100 | #227 | Tragic 97.7% |
| Sub-Saharan Africans | 3.6 /100 | #228 | Tragic 97.7% |
| Immigrants | Costa Rica | 3.5 /100 | #229 | Tragic 97.7% |
| Senegalese | 3.5 /100 | #230 | Tragic 97.7% |