Immigrants from Western Europe vs Portuguese 9th Grade
COMPARE
Immigrants from Western Europe
Portuguese
9th Grade
9th Grade Comparison
Immigrants from Western Europe
Portuguese
95.7%
9TH GRADE
99.1/ 100
METRIC RATING
86th/ 347
METRIC RANK
94.5%
9TH GRADE
9.2/ 100
METRIC RATING
218th/ 347
METRIC RANK
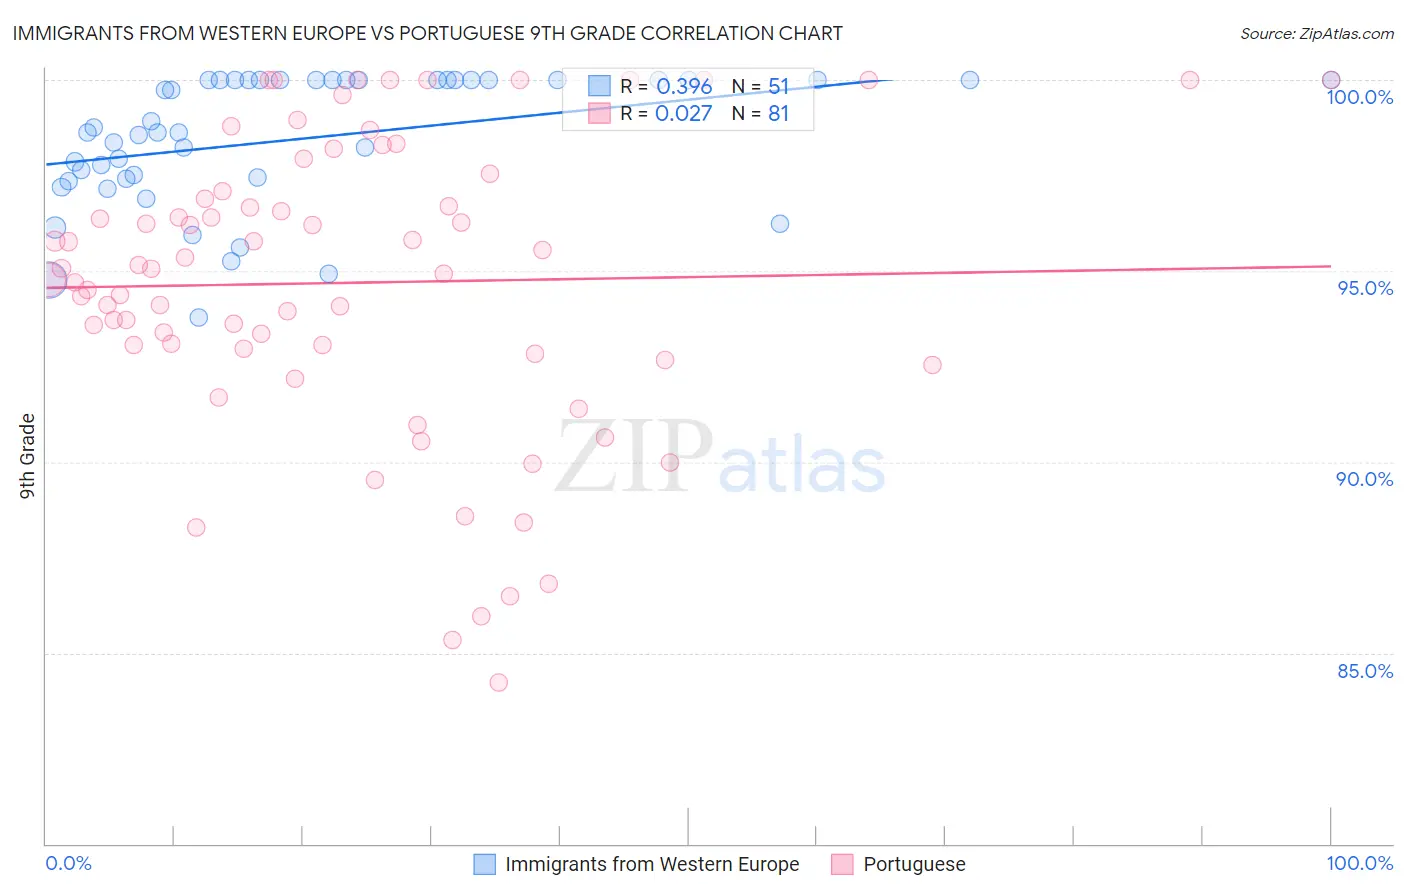
Immigrants from Western Europe vs Portuguese 9th Grade Correlation Chart
The statistical analysis conducted on geographies consisting of 494,080,521 people shows a mild positive correlation between the proportion of Immigrants from Western Europe and percentage of population with at least 9th grade education in the United States with a correlation coefficient (R) of 0.396 and weighted average of 95.7%. Similarly, the statistical analysis conducted on geographies consisting of 450,343,001 people shows no correlation between the proportion of Portuguese and percentage of population with at least 9th grade education in the United States with a correlation coefficient (R) of 0.027 and weighted average of 94.5%, a difference of 1.3%.
9th Grade Correlation Summary
| Measurement | Immigrants from Western Europe | Portuguese |
| Minimum | 93.8% | 84.2% |
| Maximum | 100.0% | 100.0% |
| Range | 6.2% | 15.8% |
| Mean | 98.5% | 94.7% |
| Median | 98.6% | 95.1% |
| Interquartile 25% (IQ1) | 97.4% | 92.9% |
| Interquartile 75% (IQ3) | 100.0% | 97.3% |
| Interquartile Range (IQR) | 2.6% | 4.4% |
| Standard Deviation (Sample) | 1.7% | 3.9% |
| Standard Deviation (Population) | 1.7% | 3.8% |
Similar Demographics by 9th Grade
Demographics Similar to Immigrants from Western Europe by 9th Grade
In terms of 9th grade, the demographic groups most similar to Immigrants from Western Europe are Immigrants from Denmark (95.7%, a difference of 0.0%), Icelander (95.7%, a difference of 0.0%), Swiss (95.7%, a difference of 0.010%), Bhutanese (95.7%, a difference of 0.030%), and Arapaho (95.7%, a difference of 0.030%).
| Demographics | Rating | Rank | 9th Grade |
| Romanians | 99.3 /100 | #79 | Exceptional 95.7% |
| Bhutanese | 99.3 /100 | #80 | Exceptional 95.7% |
| Arapaho | 99.3 /100 | #81 | Exceptional 95.7% |
| Puget Sound Salish | 99.2 /100 | #82 | Exceptional 95.7% |
| Swiss | 99.2 /100 | #83 | Exceptional 95.7% |
| Immigrants | Denmark | 99.1 /100 | #84 | Exceptional 95.7% |
| Icelanders | 99.1 /100 | #85 | Exceptional 95.7% |
| Immigrants | Western Europe | 99.1 /100 | #86 | Exceptional 95.7% |
| Okinawans | 99.0 /100 | #87 | Exceptional 95.7% |
| Immigrants | Czechoslovakia | 98.9 /100 | #88 | Exceptional 95.7% |
| Yugoslavians | 98.9 /100 | #89 | Exceptional 95.7% |
| South Africans | 98.8 /100 | #90 | Exceptional 95.6% |
| Creek | 98.8 /100 | #91 | Exceptional 95.6% |
| Immigrants | Saudi Arabia | 98.8 /100 | #92 | Exceptional 95.6% |
| Immigrants | Germany | 98.7 /100 | #93 | Exceptional 95.6% |
Demographics Similar to Portuguese by 9th Grade
In terms of 9th grade, the demographic groups most similar to Portuguese are African (94.5%, a difference of 0.0%), Asian (94.5%, a difference of 0.010%), Indian (Asian) (94.5%, a difference of 0.010%), Immigrants from Eastern Africa (94.5%, a difference of 0.020%), and Immigrants from Western Asia (94.5%, a difference of 0.030%).
| Demographics | Rating | Rank | 9th Grade |
| Immigrants | Indonesia | 12.3 /100 | #211 | Poor 94.5% |
| Immigrants | Malaysia | 12.2 /100 | #212 | Poor 94.5% |
| Immigrants | Oceania | 12.1 /100 | #213 | Poor 94.5% |
| Immigrants | Liberia | 11.8 /100 | #214 | Poor 94.5% |
| Immigrants | Syria | 11.0 /100 | #215 | Poor 94.5% |
| Immigrants | Western Asia | 10.7 /100 | #216 | Poor 94.5% |
| Asians | 9.9 /100 | #217 | Tragic 94.5% |
| Portuguese | 9.2 /100 | #218 | Tragic 94.5% |
| Africans | 9.0 /100 | #219 | Tragic 94.5% |
| Indians (Asian) | 8.6 /100 | #220 | Tragic 94.5% |
| Immigrants | Eastern Africa | 8.2 /100 | #221 | Tragic 94.5% |
| Immigrants | Asia | 7.7 /100 | #222 | Tragic 94.4% |
| Bahamians | 7.0 /100 | #223 | Tragic 94.4% |
| Tongans | 6.0 /100 | #224 | Tragic 94.4% |
| Ethiopians | 5.4 /100 | #225 | Tragic 94.4% |