Immigrants from Western Europe vs Indonesian 1st Grade
COMPARE
Immigrants from Western Europe
Indonesian
1st Grade
1st Grade Comparison
Immigrants from Western Europe
Indonesians
98.3%
1ST GRADE
98.8/ 100
METRIC RATING
91st/ 347
METRIC RANK
96.7%
1ST GRADE
0.0/ 100
METRIC RATING
326th/ 347
METRIC RANK
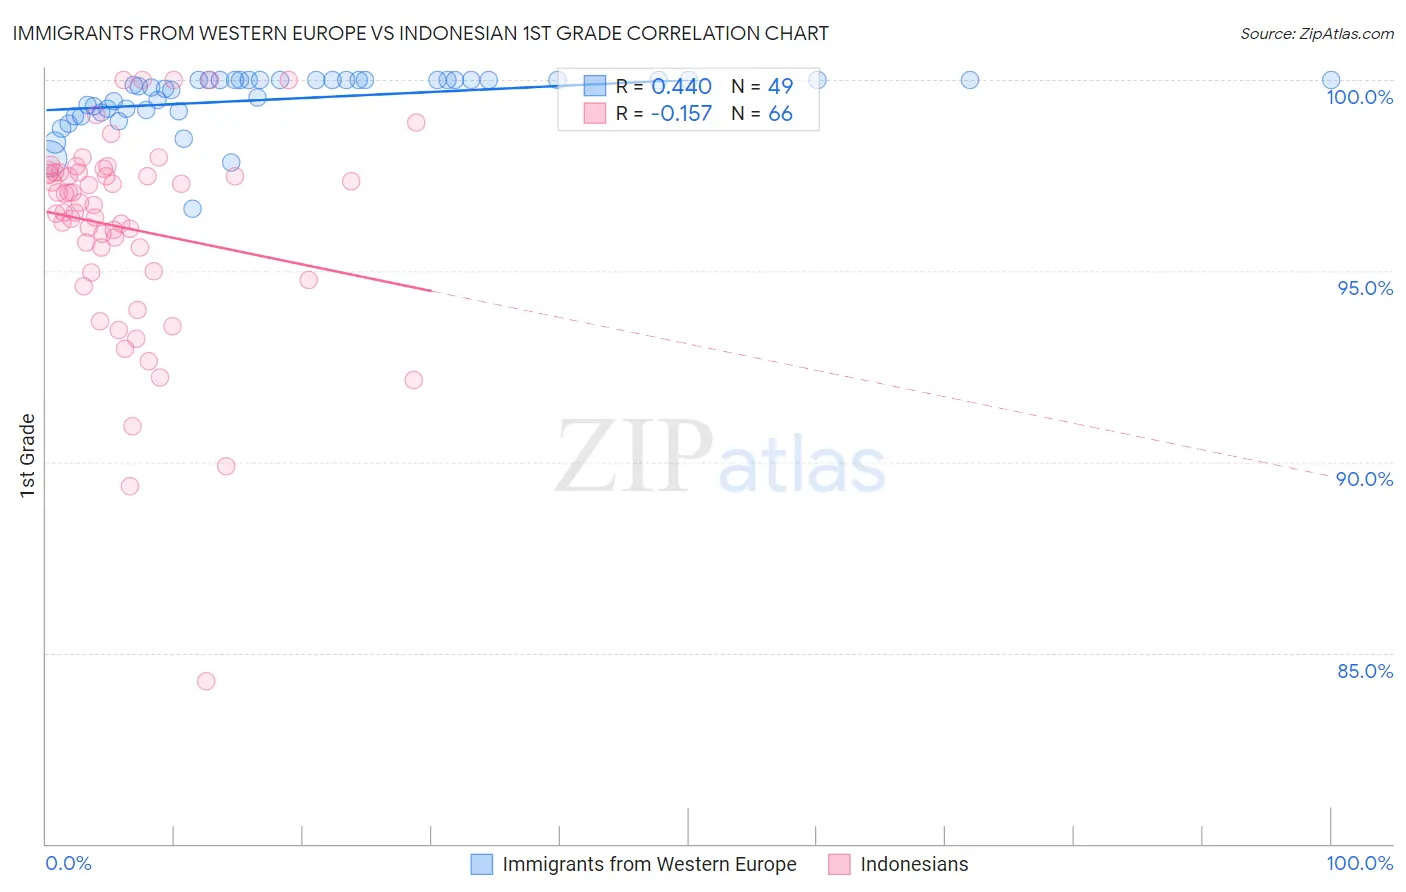
Immigrants from Western Europe vs Indonesian 1st Grade Correlation Chart
The statistical analysis conducted on geographies consisting of 494,080,297 people shows a moderate positive correlation between the proportion of Immigrants from Western Europe and percentage of population with at least 1st grade education in the United States with a correlation coefficient (R) of 0.440 and weighted average of 98.3%. Similarly, the statistical analysis conducted on geographies consisting of 162,727,113 people shows a poor negative correlation between the proportion of Indonesians and percentage of population with at least 1st grade education in the United States with a correlation coefficient (R) of -0.157 and weighted average of 96.7%, a difference of 1.6%.
1st Grade Correlation Summary
| Measurement | Immigrants from Western Europe | Indonesian |
| Minimum | 96.6% | 84.2% |
| Maximum | 100.0% | 100.0% |
| Range | 3.4% | 15.8% |
| Mean | 99.5% | 96.1% |
| Median | 99.9% | 96.8% |
| Interquartile 25% (IQ1) | 99.2% | 95.0% |
| Interquartile 75% (IQ3) | 100.0% | 97.6% |
| Interquartile Range (IQR) | 0.79% | 2.6% |
| Standard Deviation (Sample) | 0.72% | 2.7% |
| Standard Deviation (Population) | 0.71% | 2.7% |
Similar Demographics by 1st Grade
Demographics Similar to Immigrants from Western Europe by 1st Grade
In terms of 1st grade, the demographic groups most similar to Immigrants from Western Europe are Immigrants from South Africa (98.3%, a difference of 0.0%), Ukrainian (98.3%, a difference of 0.0%), Macedonian (98.3%, a difference of 0.0%), Immigrants from Australia (98.3%, a difference of 0.010%), and Zimbabwean (98.3%, a difference of 0.010%).
| Demographics | Rating | Rank | 1st Grade |
| Delaware | 99.1 /100 | #84 | Exceptional 98.3% |
| Hopi | 99.0 /100 | #85 | Exceptional 98.3% |
| Immigrants | Denmark | 99.0 /100 | #86 | Exceptional 98.3% |
| Immigrants | Australia | 99.0 /100 | #87 | Exceptional 98.3% |
| Zimbabweans | 98.9 /100 | #88 | Exceptional 98.3% |
| Immigrants | South Africa | 98.8 /100 | #89 | Exceptional 98.3% |
| Ukrainians | 98.8 /100 | #90 | Exceptional 98.3% |
| Immigrants | Western Europe | 98.8 /100 | #91 | Exceptional 98.3% |
| Macedonians | 98.7 /100 | #92 | Exceptional 98.3% |
| Immigrants | India | 98.6 /100 | #93 | Exceptional 98.2% |
| South Africans | 98.6 /100 | #94 | Exceptional 98.2% |
| Immigrants | Germany | 98.5 /100 | #95 | Exceptional 98.2% |
| Cypriots | 98.3 /100 | #96 | Exceptional 98.2% |
| Immigrants | Nonimmigrants | 98.3 /100 | #97 | Exceptional 98.2% |
| Choctaw | 98.3 /100 | #98 | Exceptional 98.2% |
Demographics Similar to Indonesians by 1st Grade
In terms of 1st grade, the demographic groups most similar to Indonesians are Dominican (96.7%, a difference of 0.0%), Vietnamese (96.8%, a difference of 0.020%), Immigrants from Honduras (96.8%, a difference of 0.030%), Mexican American Indian (96.8%, a difference of 0.040%), and Immigrants from Burma/Myanmar (96.8%, a difference of 0.060%).
| Demographics | Rating | Rank | 1st Grade |
| Immigrants | Guyana | 0.0 /100 | #319 | Tragic 96.8% |
| Immigrants | Burma/Myanmar | 0.0 /100 | #320 | Tragic 96.8% |
| Immigrants | Bangladesh | 0.0 /100 | #321 | Tragic 96.8% |
| Mexican American Indians | 0.0 /100 | #322 | Tragic 96.8% |
| Immigrants | Honduras | 0.0 /100 | #323 | Tragic 96.8% |
| Vietnamese | 0.0 /100 | #324 | Tragic 96.8% |
| Dominicans | 0.0 /100 | #325 | Tragic 96.7% |
| Indonesians | 0.0 /100 | #326 | Tragic 96.7% |
| Mexicans | 0.0 /100 | #327 | Tragic 96.7% |
| Immigrants | Latin America | 0.0 /100 | #328 | Tragic 96.7% |
| Japanese | 0.0 /100 | #329 | Tragic 96.6% |
| Immigrants | Vietnam | 0.0 /100 | #330 | Tragic 96.6% |
| Immigrants | Armenia | 0.0 /100 | #331 | Tragic 96.6% |
| Central Americans | 0.0 /100 | #332 | Tragic 96.5% |
| Immigrants | Dominican Republic | 0.0 /100 | #333 | Tragic 96.5% |