Immigrants from Western Europe vs Canadian 2nd Grade
COMPARE
Immigrants from Western Europe
Canadian
2nd Grade
2nd Grade Comparison
Immigrants from Western Europe
Canadians
98.2%
2ND GRADE
98.8/ 100
METRIC RATING
91st/ 347
METRIC RANK
98.3%
2ND GRADE
99.7/ 100
METRIC RATING
66th/ 347
METRIC RANK
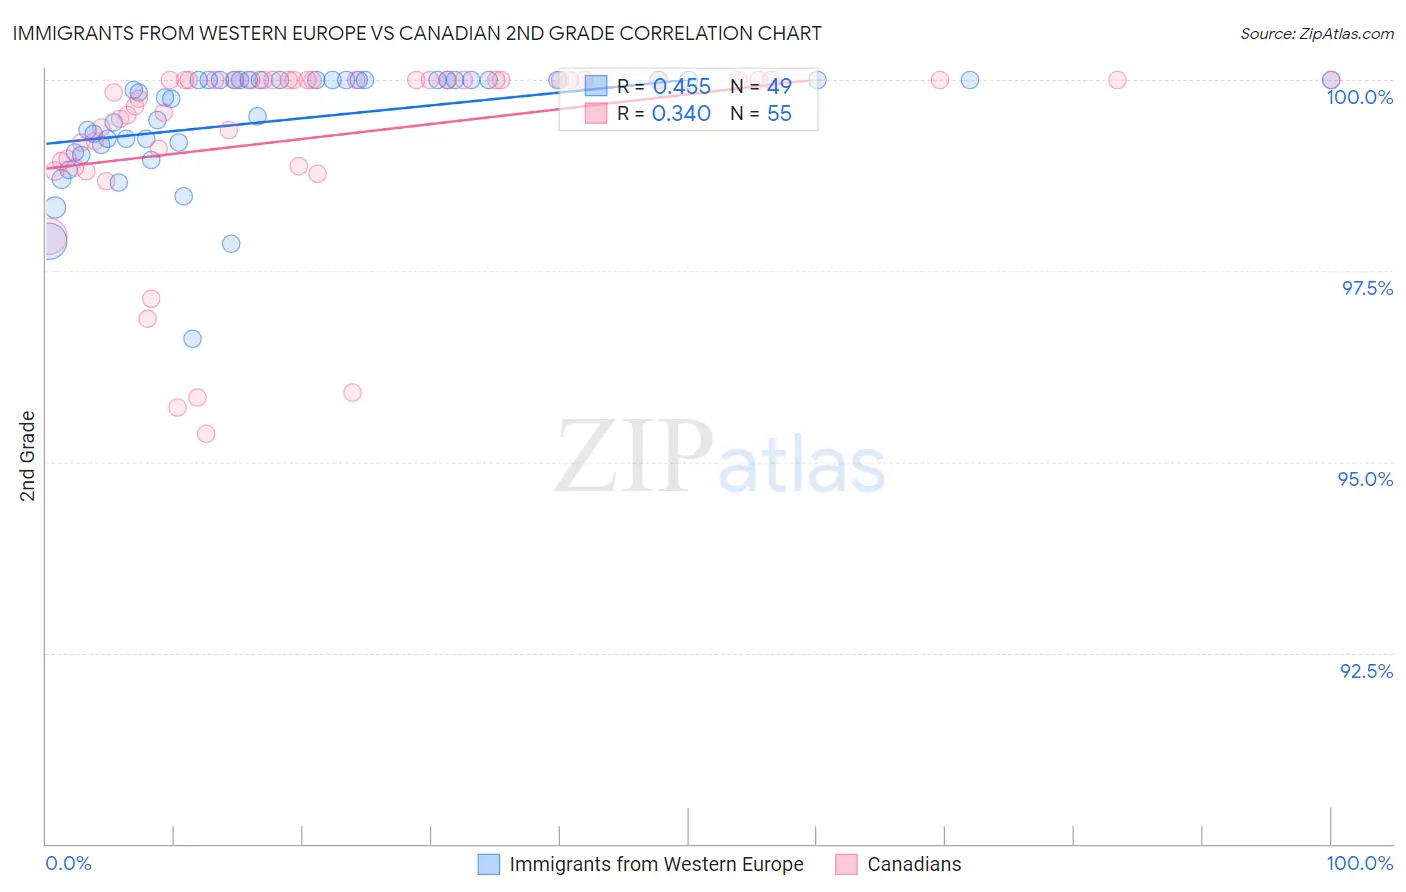
Immigrants from Western Europe vs Canadian 2nd Grade Correlation Chart
The statistical analysis conducted on geographies consisting of 494,080,297 people shows a moderate positive correlation between the proportion of Immigrants from Western Europe and percentage of population with at least 2nd grade education in the United States with a correlation coefficient (R) of 0.455 and weighted average of 98.2%. Similarly, the statistical analysis conducted on geographies consisting of 437,557,033 people shows a mild positive correlation between the proportion of Canadians and percentage of population with at least 2nd grade education in the United States with a correlation coefficient (R) of 0.340 and weighted average of 98.3%, a difference of 0.10%.
2nd Grade Correlation Summary
| Measurement | Immigrants from Western Europe | Canadian |
| Minimum | 96.6% | 95.4% |
| Maximum | 100.0% | 100.0% |
| Range | 3.4% | 4.6% |
| Mean | 99.5% | 99.3% |
| Median | 99.9% | 100.0% |
| Interquartile 25% (IQ1) | 99.2% | 98.9% |
| Interquartile 75% (IQ3) | 100.0% | 100.0% |
| Interquartile Range (IQR) | 0.84% | 1.1% |
| Standard Deviation (Sample) | 0.73% | 1.2% |
| Standard Deviation (Population) | 0.72% | 1.2% |
Similar Demographics by 2nd Grade
Demographics Similar to Immigrants from Western Europe by 2nd Grade
In terms of 2nd grade, the demographic groups most similar to Immigrants from Western Europe are Zimbabwean (98.2%, a difference of 0.0%), Immigrants from South Africa (98.2%, a difference of 0.0%), Immigrants from India (98.2%, a difference of 0.0%), Immigrants from Australia (98.2%, a difference of 0.010%), and Immigrants from Denmark (98.2%, a difference of 0.010%).
| Demographics | Rating | Rank | 2nd Grade |
| Hopi | 99.1 /100 | #84 | Exceptional 98.2% |
| Potawatomi | 99.1 /100 | #85 | Exceptional 98.2% |
| Immigrants | Australia | 99.0 /100 | #86 | Exceptional 98.2% |
| Immigrants | Denmark | 99.0 /100 | #87 | Exceptional 98.2% |
| Macedonians | 99.0 /100 | #88 | Exceptional 98.2% |
| Ukrainians | 98.9 /100 | #89 | Exceptional 98.2% |
| Zimbabweans | 98.8 /100 | #90 | Exceptional 98.2% |
| Immigrants | Western Europe | 98.8 /100 | #91 | Exceptional 98.2% |
| Immigrants | South Africa | 98.8 /100 | #92 | Exceptional 98.2% |
| Immigrants | India | 98.8 /100 | #93 | Exceptional 98.2% |
| Immigrants | Germany | 98.6 /100 | #94 | Exceptional 98.2% |
| South Africans | 98.6 /100 | #95 | Exceptional 98.2% |
| Cypriots | 98.4 /100 | #96 | Exceptional 98.2% |
| Choctaw | 98.3 /100 | #97 | Exceptional 98.2% |
| Immigrants | Nonimmigrants | 98.3 /100 | #98 | Exceptional 98.2% |
Demographics Similar to Canadians by 2nd Grade
In terms of 2nd grade, the demographic groups most similar to Canadians are Immigrants from Northern Europe (98.3%, a difference of 0.0%), Russian (98.3%, a difference of 0.0%), New Zealander (98.3%, a difference of 0.010%), Immigrants from Austria (98.3%, a difference of 0.010%), and Serbian (98.3%, a difference of 0.010%).
| Demographics | Rating | Rank | 2nd Grade |
| Slavs | 99.8 /100 | #59 | Exceptional 98.3% |
| Creek | 99.8 /100 | #60 | Exceptional 98.3% |
| Immigrants | Canada | 99.8 /100 | #61 | Exceptional 98.3% |
| Greeks | 99.8 /100 | #62 | Exceptional 98.3% |
| Maltese | 99.7 /100 | #63 | Exceptional 98.3% |
| Immigrants | North America | 99.7 /100 | #64 | Exceptional 98.3% |
| New Zealanders | 99.7 /100 | #65 | Exceptional 98.3% |
| Canadians | 99.7 /100 | #66 | Exceptional 98.3% |
| Immigrants | Northern Europe | 99.7 /100 | #67 | Exceptional 98.3% |
| Russians | 99.7 /100 | #68 | Exceptional 98.3% |
| Immigrants | Austria | 99.6 /100 | #69 | Exceptional 98.3% |
| Serbians | 99.6 /100 | #70 | Exceptional 98.3% |
| Chickasaw | 99.6 /100 | #71 | Exceptional 98.3% |
| Cheyenne | 99.6 /100 | #72 | Exceptional 98.3% |
| Cajuns | 99.5 /100 | #73 | Exceptional 98.3% |