Immigrants from Western Africa vs Immigrants from Congo 3rd Grade
COMPARE
Immigrants from Western Africa
Immigrants from Congo
3rd Grade
3rd Grade Comparison
Immigrants from Western Africa
Immigrants from Congo
97.2%
3RD GRADE
0.1/ 100
METRIC RATING
278th/ 347
METRIC RANK
97.3%
3RD GRADE
0.6/ 100
METRIC RATING
256th/ 347
METRIC RANK
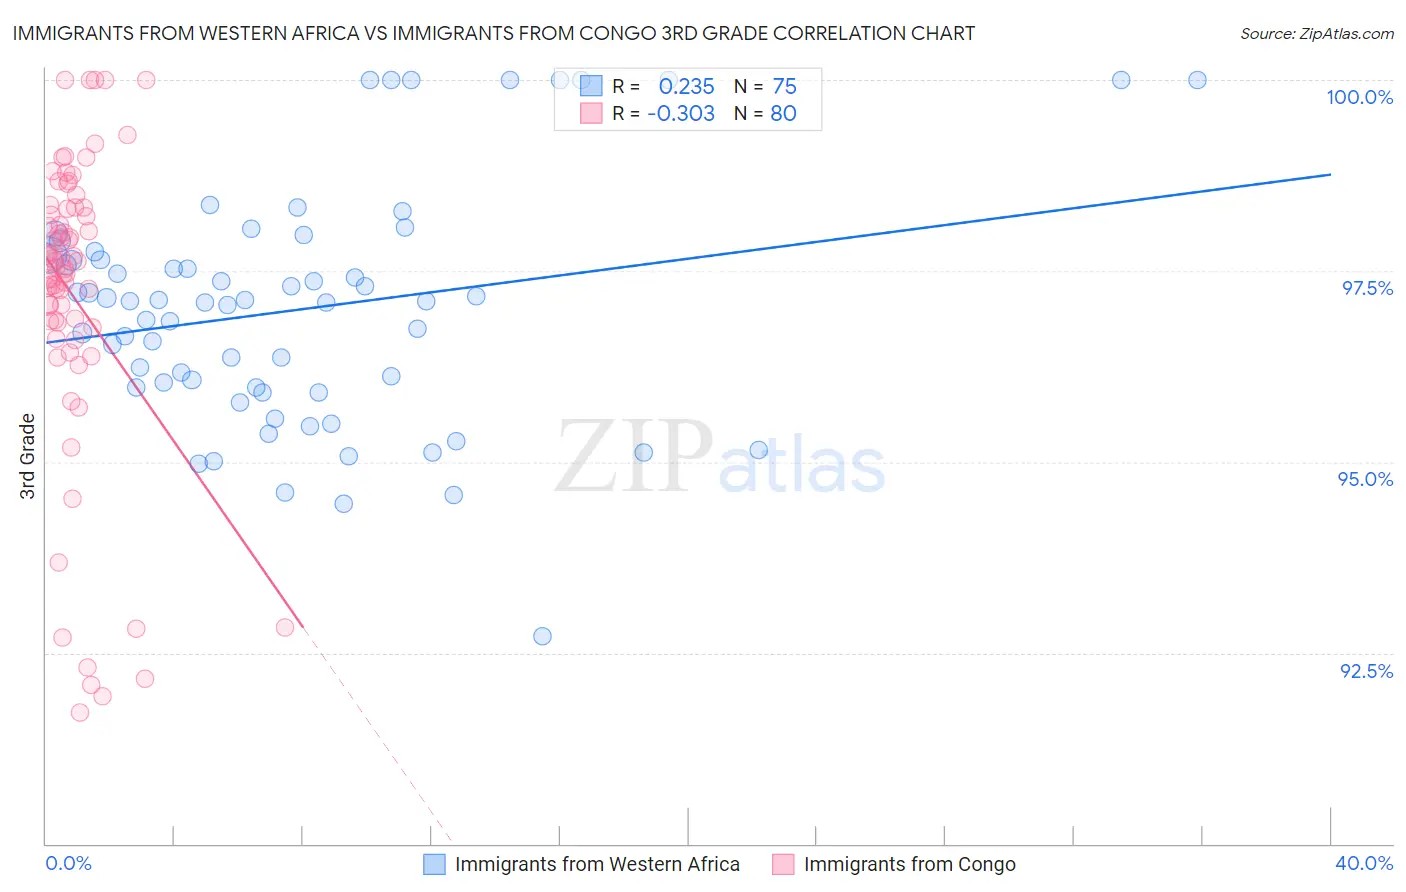
Immigrants from Western Africa vs Immigrants from Congo 3rd Grade Correlation Chart
The statistical analysis conducted on geographies consisting of 357,811,354 people shows a weak positive correlation between the proportion of Immigrants from Western Africa and percentage of population with at least 3rd grade education in the United States with a correlation coefficient (R) of 0.235 and weighted average of 97.2%. Similarly, the statistical analysis conducted on geographies consisting of 92,124,753 people shows a mild negative correlation between the proportion of Immigrants from Congo and percentage of population with at least 3rd grade education in the United States with a correlation coefficient (R) of -0.303 and weighted average of 97.3%, a difference of 0.16%.
3rd Grade Correlation Summary
| Measurement | Immigrants from Western Africa | Immigrants from Congo |
| Minimum | 92.7% | 91.7% |
| Maximum | 100.0% | 100.0% |
| Range | 7.3% | 8.3% |
| Mean | 97.0% | 97.2% |
| Median | 97.1% | 97.6% |
| Interquartile 25% (IQ1) | 96.0% | 96.8% |
| Interquartile 75% (IQ3) | 97.7% | 98.3% |
| Interquartile Range (IQR) | 1.7% | 1.5% |
| Standard Deviation (Sample) | 1.5% | 2.0% |
| Standard Deviation (Population) | 1.5% | 2.0% |
Similar Demographics by 3rd Grade
Demographics Similar to Immigrants from Western Africa by 3rd Grade
In terms of 3rd grade, the demographic groups most similar to Immigrants from Western Africa are Immigrants from Bolivia (97.2%, a difference of 0.0%), Trinidadian and Tobagonian (97.2%, a difference of 0.0%), Immigrants from Philippines (97.2%, a difference of 0.010%), Immigrants from Ghana (97.2%, a difference of 0.010%), and Immigrants from Uzbekistan (97.2%, a difference of 0.020%).
| Demographics | Rating | Rank | 3rd Grade |
| Puerto Ricans | 0.2 /100 | #271 | Tragic 97.2% |
| Ghanaians | 0.1 /100 | #272 | Tragic 97.2% |
| Immigrants | Peru | 0.1 /100 | #273 | Tragic 97.2% |
| Immigrants | Cameroon | 0.1 /100 | #274 | Tragic 97.2% |
| Immigrants | Uzbekistan | 0.1 /100 | #275 | Tragic 97.2% |
| Immigrants | Bolivia | 0.1 /100 | #276 | Tragic 97.2% |
| Trinidadians and Tobagonians | 0.1 /100 | #277 | Tragic 97.2% |
| Immigrants | Western Africa | 0.1 /100 | #278 | Tragic 97.2% |
| Immigrants | Philippines | 0.1 /100 | #279 | Tragic 97.2% |
| Immigrants | Ghana | 0.1 /100 | #280 | Tragic 97.2% |
| Barbadians | 0.1 /100 | #281 | Tragic 97.2% |
| Afghans | 0.1 /100 | #282 | Tragic 97.1% |
| Houma | 0.1 /100 | #283 | Tragic 97.1% |
| Immigrants | Trinidad and Tobago | 0.0 /100 | #284 | Tragic 97.1% |
| Immigrants | Hong Kong | 0.0 /100 | #285 | Tragic 97.1% |
Demographics Similar to Immigrants from Congo by 3rd Grade
In terms of 3rd grade, the demographic groups most similar to Immigrants from Congo are Bolivian (97.3%, a difference of 0.0%), Immigrants from Colombia (97.3%, a difference of 0.010%), Jamaican (97.4%, a difference of 0.020%), Immigrants from Liberia (97.3%, a difference of 0.020%), and Armenian (97.3%, a difference of 0.020%).
| Demographics | Rating | Rank | 3rd Grade |
| South Americans | 0.9 /100 | #249 | Tragic 97.4% |
| Immigrants | Middle Africa | 0.9 /100 | #250 | Tragic 97.4% |
| Immigrants | Asia | 0.8 /100 | #251 | Tragic 97.4% |
| Peruvians | 0.8 /100 | #252 | Tragic 97.4% |
| Immigrants | Africa | 0.8 /100 | #253 | Tragic 97.4% |
| Jamaicans | 0.7 /100 | #254 | Tragic 97.4% |
| Bolivians | 0.6 /100 | #255 | Tragic 97.3% |
| Immigrants | Congo | 0.6 /100 | #256 | Tragic 97.3% |
| Immigrants | Colombia | 0.5 /100 | #257 | Tragic 97.3% |
| Immigrants | Liberia | 0.5 /100 | #258 | Tragic 97.3% |
| Armenians | 0.4 /100 | #259 | Tragic 97.3% |
| Immigrants | Ethiopia | 0.4 /100 | #260 | Tragic 97.3% |
| Immigrants | South America | 0.4 /100 | #261 | Tragic 97.3% |
| Immigrants | Sierra Leone | 0.4 /100 | #262 | Tragic 97.3% |
| Taiwanese | 0.3 /100 | #263 | Tragic 97.3% |