Immigrants from West Indies vs Swiss 9th Grade
COMPARE
Immigrants from West Indies
Swiss
9th Grade
9th Grade Comparison
Immigrants from West Indies
Swiss
93.3%
9TH GRADE
0.0/ 100
METRIC RATING
289th/ 347
METRIC RANK
95.7%
9TH GRADE
99.2/ 100
METRIC RATING
83rd/ 347
METRIC RANK
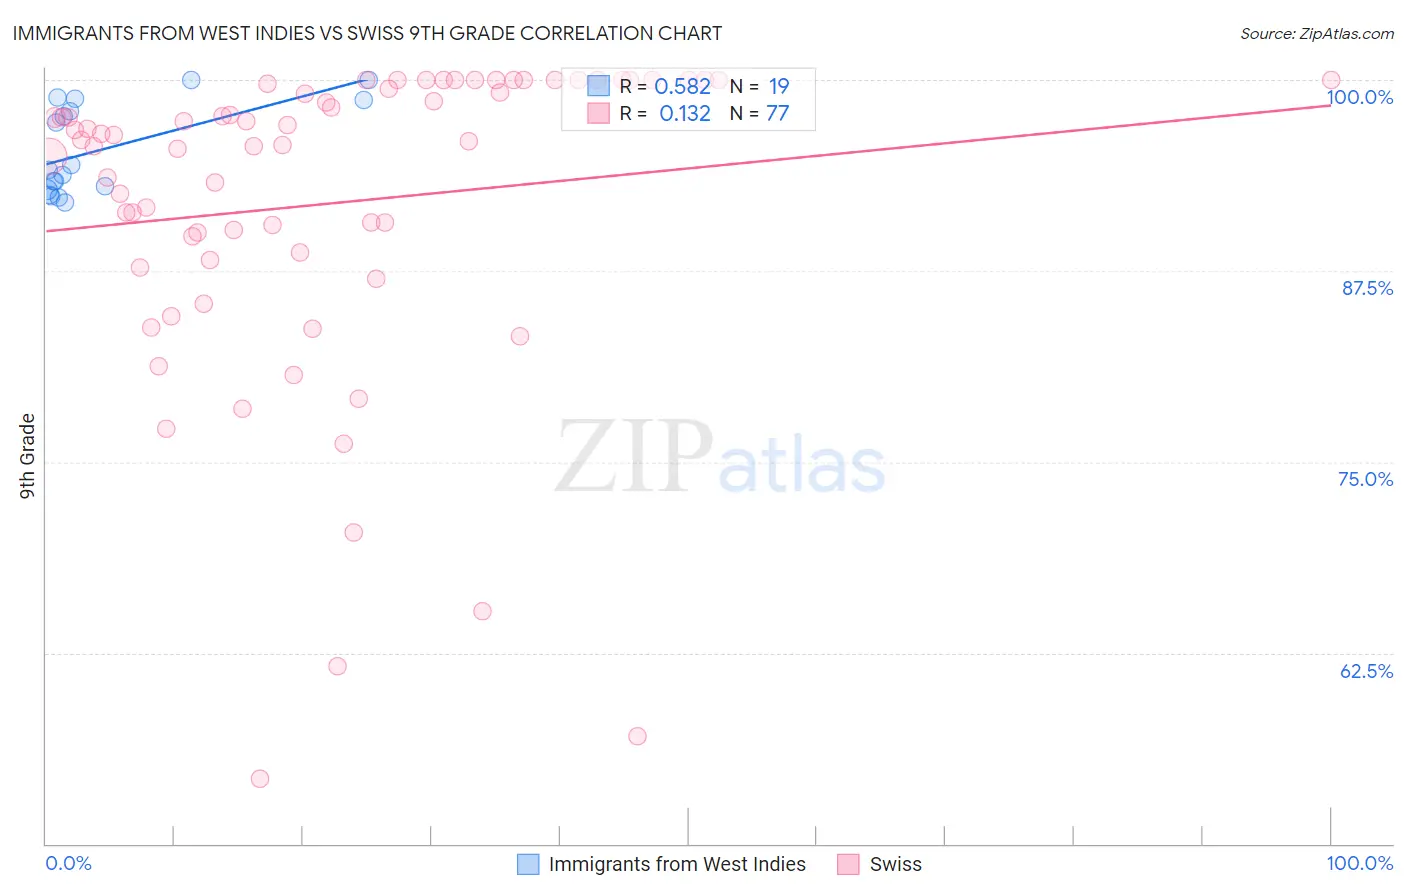
Immigrants from West Indies vs Swiss 9th Grade Correlation Chart
The statistical analysis conducted on geographies consisting of 72,457,514 people shows a substantial positive correlation between the proportion of Immigrants from West Indies and percentage of population with at least 9th grade education in the United States with a correlation coefficient (R) of 0.582 and weighted average of 93.3%. Similarly, the statistical analysis conducted on geographies consisting of 465,022,424 people shows a poor positive correlation between the proportion of Swiss and percentage of population with at least 9th grade education in the United States with a correlation coefficient (R) of 0.132 and weighted average of 95.7%, a difference of 2.6%.
9th Grade Correlation Summary
| Measurement | Immigrants from West Indies | Swiss |
| Minimum | 92.0% | 54.2% |
| Maximum | 100.0% | 100.0% |
| Range | 8.0% | 45.8% |
| Mean | 95.4% | 91.9% |
| Median | 94.1% | 96.1% |
| Interquartile 25% (IQ1) | 92.8% | 88.4% |
| Interquartile 75% (IQ3) | 98.7% | 99.9% |
| Interquartile Range (IQR) | 5.8% | 11.4% |
| Standard Deviation (Sample) | 2.9% | 10.4% |
| Standard Deviation (Population) | 2.9% | 10.3% |
Similar Demographics by 9th Grade
Demographics Similar to Immigrants from West Indies by 9th Grade
In terms of 9th grade, the demographic groups most similar to Immigrants from West Indies are Pennsylvania German (93.3%, a difference of 0.0%), Immigrants from South Eastern Asia (93.3%, a difference of 0.060%), Immigrants from St. Vincent and the Grenadines (93.4%, a difference of 0.090%), British West Indian (93.2%, a difference of 0.090%), and Immigrants from Barbados (93.4%, a difference of 0.10%).
| Demographics | Rating | Rank | 9th Grade |
| Malaysians | 0.0 /100 | #282 | Tragic 93.5% |
| Barbadians | 0.0 /100 | #283 | Tragic 93.5% |
| Bangladeshis | 0.0 /100 | #284 | Tragic 93.4% |
| Immigrants | Peru | 0.0 /100 | #285 | Tragic 93.4% |
| Immigrants | Barbados | 0.0 /100 | #286 | Tragic 93.4% |
| Immigrants | St. Vincent and the Grenadines | 0.0 /100 | #287 | Tragic 93.4% |
| Immigrants | South Eastern Asia | 0.0 /100 | #288 | Tragic 93.3% |
| Immigrants | West Indies | 0.0 /100 | #289 | Tragic 93.3% |
| Pennsylvania Germans | 0.0 /100 | #290 | Tragic 93.3% |
| British West Indians | 0.0 /100 | #291 | Tragic 93.2% |
| Immigrants | Laos | 0.0 /100 | #292 | Tragic 93.2% |
| Sri Lankans | 0.0 /100 | #293 | Tragic 93.2% |
| Cubans | 0.0 /100 | #294 | Tragic 93.2% |
| Immigrants | Burma/Myanmar | 0.0 /100 | #295 | Tragic 93.1% |
| Indonesians | 0.0 /100 | #296 | Tragic 93.1% |
Demographics Similar to Swiss by 9th Grade
In terms of 9th grade, the demographic groups most similar to Swiss are Immigrants from Denmark (95.7%, a difference of 0.010%), Icelander (95.7%, a difference of 0.010%), Immigrants from Western Europe (95.7%, a difference of 0.010%), Bhutanese (95.7%, a difference of 0.020%), and Arapaho (95.7%, a difference of 0.020%).
| Demographics | Rating | Rank | 9th Grade |
| Immigrants | Sweden | 99.5 /100 | #76 | Exceptional 95.8% |
| Whites/Caucasians | 99.4 /100 | #77 | Exceptional 95.8% |
| Immigrants | South Africa | 99.4 /100 | #78 | Exceptional 95.8% |
| Romanians | 99.3 /100 | #79 | Exceptional 95.7% |
| Bhutanese | 99.3 /100 | #80 | Exceptional 95.7% |
| Arapaho | 99.3 /100 | #81 | Exceptional 95.7% |
| Puget Sound Salish | 99.2 /100 | #82 | Exceptional 95.7% |
| Swiss | 99.2 /100 | #83 | Exceptional 95.7% |
| Immigrants | Denmark | 99.1 /100 | #84 | Exceptional 95.7% |
| Icelanders | 99.1 /100 | #85 | Exceptional 95.7% |
| Immigrants | Western Europe | 99.1 /100 | #86 | Exceptional 95.7% |
| Okinawans | 99.0 /100 | #87 | Exceptional 95.7% |
| Immigrants | Czechoslovakia | 98.9 /100 | #88 | Exceptional 95.7% |
| Yugoslavians | 98.9 /100 | #89 | Exceptional 95.7% |
| South Africans | 98.8 /100 | #90 | Exceptional 95.6% |