Immigrants from West Indies vs Immigrants from Sri Lanka 5th Grade
COMPARE
Immigrants from West Indies
Immigrants from Sri Lanka
5th Grade
5th Grade Comparison
Immigrants from West Indies
Immigrants from Sri Lanka
96.5%
5TH GRADE
0.0/ 100
METRIC RATING
289th/ 347
METRIC RANK
97.3%
5TH GRADE
53.8/ 100
METRIC RATING
171st/ 347
METRIC RANK
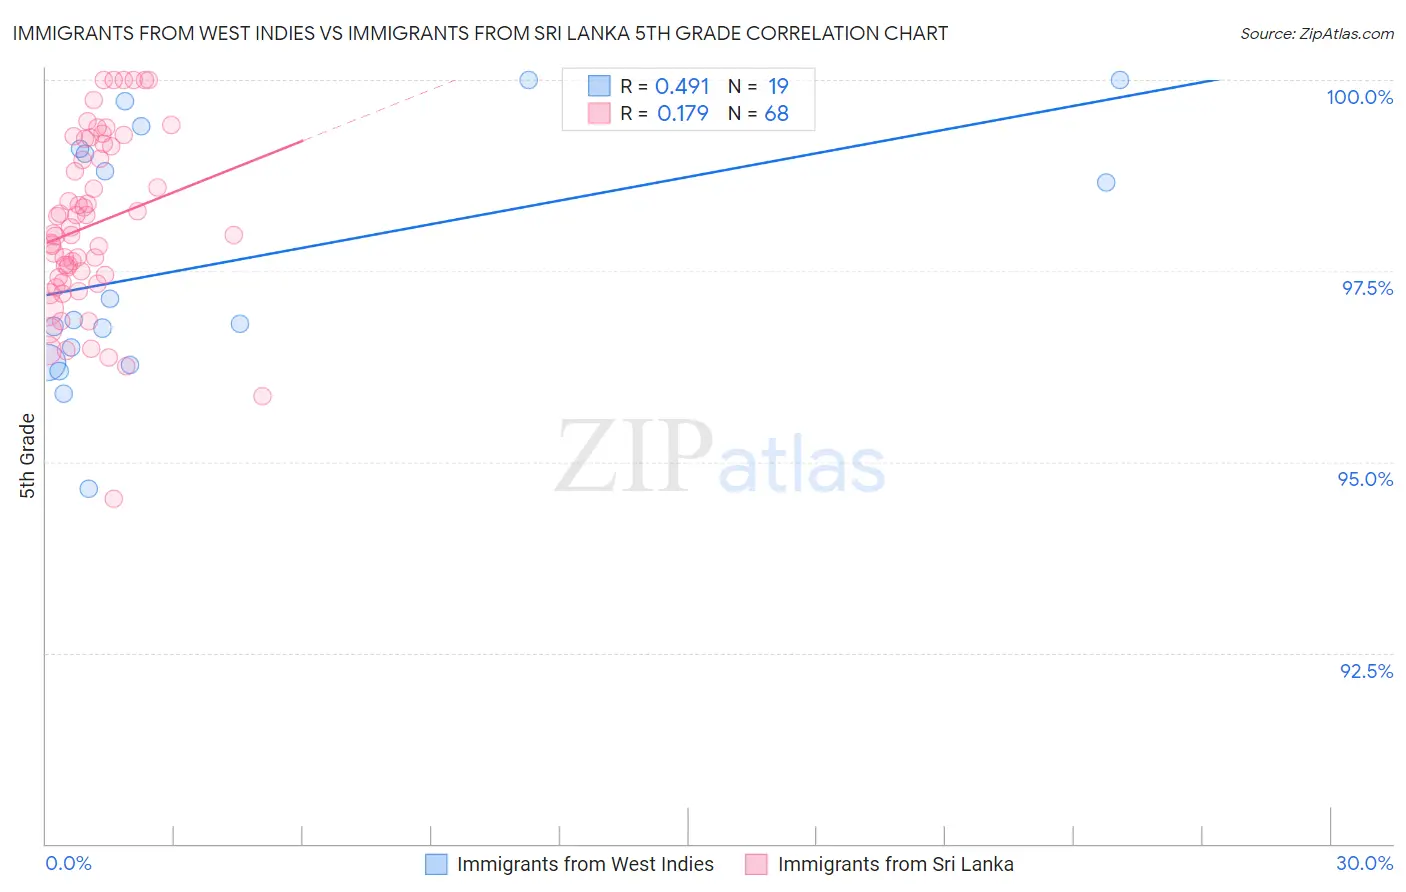
Immigrants from West Indies vs Immigrants from Sri Lanka 5th Grade Correlation Chart
The statistical analysis conducted on geographies consisting of 72,457,514 people shows a moderate positive correlation between the proportion of Immigrants from West Indies and percentage of population with at least 5th grade education in the United States with a correlation coefficient (R) of 0.491 and weighted average of 96.5%. Similarly, the statistical analysis conducted on geographies consisting of 149,660,761 people shows a poor positive correlation between the proportion of Immigrants from Sri Lanka and percentage of population with at least 5th grade education in the United States with a correlation coefficient (R) of 0.179 and weighted average of 97.3%, a difference of 0.88%.
5th Grade Correlation Summary
| Measurement | Immigrants from West Indies | Immigrants from Sri Lanka |
| Minimum | 94.6% | 94.5% |
| Maximum | 100.0% | 100.0% |
| Range | 5.4% | 5.5% |
| Mean | 97.6% | 98.1% |
| Median | 96.9% | 98.0% |
| Interquartile 25% (IQ1) | 96.3% | 97.4% |
| Interquartile 75% (IQ3) | 99.1% | 99.1% |
| Interquartile Range (IQR) | 2.8% | 1.8% |
| Standard Deviation (Sample) | 1.6% | 1.2% |
| Standard Deviation (Population) | 1.6% | 1.1% |
Similar Demographics by 5th Grade
Demographics Similar to Immigrants from West Indies by 5th Grade
In terms of 5th grade, the demographic groups most similar to Immigrants from West Indies are British West Indian (96.5%, a difference of 0.020%), Malaysian (96.5%, a difference of 0.020%), Somali (96.5%, a difference of 0.020%), Immigrants from Grenada (96.5%, a difference of 0.040%), and Immigrants from Afghanistan (96.6%, a difference of 0.070%).
| Demographics | Rating | Rank | 5th Grade |
| Barbadians | 0.1 /100 | #282 | Tragic 96.6% |
| Fijians | 0.1 /100 | #283 | Tragic 96.6% |
| Immigrants | Trinidad and Tobago | 0.1 /100 | #284 | Tragic 96.6% |
| Immigrants | St. Vincent and the Grenadines | 0.1 /100 | #285 | Tragic 96.6% |
| Immigrants | Thailand | 0.1 /100 | #286 | Tragic 96.6% |
| Immigrants | Afghanistan | 0.1 /100 | #287 | Tragic 96.6% |
| Immigrants | Barbados | 0.0 /100 | #288 | Tragic 96.6% |
| Immigrants | West Indies | 0.0 /100 | #289 | Tragic 96.5% |
| British West Indians | 0.0 /100 | #290 | Tragic 96.5% |
| Malaysians | 0.0 /100 | #291 | Tragic 96.5% |
| Somalis | 0.0 /100 | #292 | Tragic 96.5% |
| Immigrants | Grenada | 0.0 /100 | #293 | Tragic 96.5% |
| Immigrants | Eritrea | 0.0 /100 | #294 | Tragic 96.4% |
| Immigrants | Somalia | 0.0 /100 | #295 | Tragic 96.4% |
| Immigrants | South Eastern Asia | 0.0 /100 | #296 | Tragic 96.3% |
Demographics Similar to Immigrants from Sri Lanka by 5th Grade
In terms of 5th grade, the demographic groups most similar to Immigrants from Sri Lanka are Immigrants from Belarus (97.3%, a difference of 0.0%), Chilean (97.3%, a difference of 0.0%), Immigrants from Korea (97.3%, a difference of 0.0%), Venezuelan (97.3%, a difference of 0.0%), and Arab (97.3%, a difference of 0.0%).
| Demographics | Rating | Rank | 5th Grade |
| Bermudans | 58.8 /100 | #164 | Average 97.4% |
| Immigrants | Poland | 57.9 /100 | #165 | Average 97.4% |
| Apache | 57.2 /100 | #166 | Average 97.4% |
| Immigrants | Belarus | 54.6 /100 | #167 | Average 97.3% |
| Chileans | 54.5 /100 | #168 | Average 97.3% |
| Immigrants | Korea | 54.1 /100 | #169 | Average 97.3% |
| Venezuelans | 54.0 /100 | #170 | Average 97.3% |
| Immigrants | Sri Lanka | 53.8 /100 | #171 | Average 97.3% |
| Arabs | 53.4 /100 | #172 | Average 97.3% |
| Egyptians | 52.4 /100 | #173 | Average 97.3% |
| Immigrants | Kazakhstan | 50.0 /100 | #174 | Average 97.3% |
| Immigrants | Micronesia | 48.8 /100 | #175 | Average 97.3% |
| Immigrants | Taiwan | 48.4 /100 | #176 | Average 97.3% |
| Immigrants | Spain | 47.0 /100 | #177 | Average 97.3% |
| Comanche | 42.1 /100 | #178 | Average 97.3% |