Immigrants from Vietnam vs Spanish American 10th Grade
COMPARE
Immigrants from Vietnam
Spanish American
10th Grade
10th Grade Comparison
Immigrants from Vietnam
Spanish Americans
91.2%
10TH GRADE
0.0/ 100
METRIC RATING
303rd/ 347
METRIC RANK
92.9%
10TH GRADE
2.1/ 100
METRIC RATING
244th/ 347
METRIC RANK
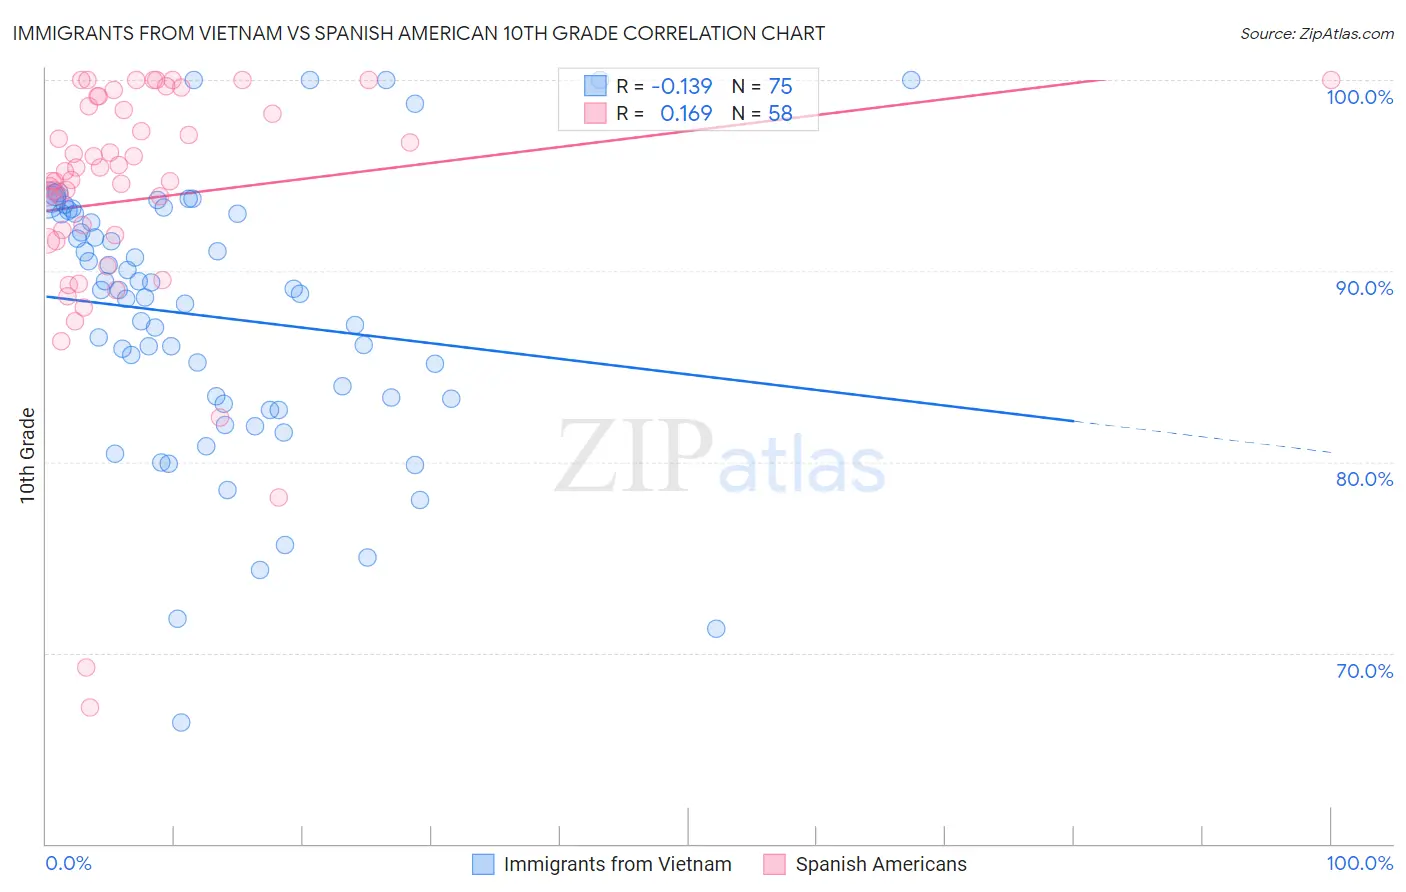
Immigrants from Vietnam vs Spanish American 10th Grade Correlation Chart
The statistical analysis conducted on geographies consisting of 404,843,921 people shows a poor negative correlation between the proportion of Immigrants from Vietnam and percentage of population with at least 10th grade education in the United States with a correlation coefficient (R) of -0.139 and weighted average of 91.2%. Similarly, the statistical analysis conducted on geographies consisting of 103,166,592 people shows a poor positive correlation between the proportion of Spanish Americans and percentage of population with at least 10th grade education in the United States with a correlation coefficient (R) of 0.169 and weighted average of 92.9%, a difference of 1.9%.
10th Grade Correlation Summary
| Measurement | Immigrants from Vietnam | Spanish American |
| Minimum | 66.3% | 67.1% |
| Maximum | 100.0% | 100.0% |
| Range | 33.7% | 32.9% |
| Mean | 87.6% | 93.8% |
| Median | 88.8% | 95.0% |
| Interquartile 25% (IQ1) | 83.1% | 91.6% |
| Interquartile 75% (IQ3) | 93.0% | 98.7% |
| Interquartile Range (IQR) | 10.0% | 7.1% |
| Standard Deviation (Sample) | 7.1% | 6.8% |
| Standard Deviation (Population) | 7.0% | 6.7% |
Similar Demographics by 10th Grade
Demographics Similar to Immigrants from Vietnam by 10th Grade
In terms of 10th grade, the demographic groups most similar to Immigrants from Vietnam are Immigrants from Guyana (91.2%, a difference of 0.020%), Japanese (91.2%, a difference of 0.030%), Pima (91.2%, a difference of 0.060%), Immigrants from Dominica (91.1%, a difference of 0.070%), and Yaqui (91.1%, a difference of 0.13%).
| Demographics | Rating | Rank | 10th Grade |
| Immigrants | Grenada | 0.0 /100 | #296 | Tragic 91.6% |
| Fijians | 0.0 /100 | #297 | Tragic 91.5% |
| Cubans | 0.0 /100 | #298 | Tragic 91.5% |
| Immigrants | Haiti | 0.0 /100 | #299 | Tragic 91.4% |
| Guyanese | 0.0 /100 | #300 | Tragic 91.4% |
| Japanese | 0.0 /100 | #301 | Tragic 91.2% |
| Immigrants | Guyana | 0.0 /100 | #302 | Tragic 91.2% |
| Immigrants | Vietnam | 0.0 /100 | #303 | Tragic 91.2% |
| Pima | 0.0 /100 | #304 | Tragic 91.2% |
| Immigrants | Dominica | 0.0 /100 | #305 | Tragic 91.1% |
| Yaqui | 0.0 /100 | #306 | Tragic 91.1% |
| Immigrants | Fiji | 0.0 /100 | #307 | Tragic 91.0% |
| Immigrants | Bangladesh | 0.0 /100 | #308 | Tragic 91.0% |
| Immigrants | Immigrants | 0.0 /100 | #309 | Tragic 91.0% |
| Vietnamese | 0.0 /100 | #310 | Tragic 90.9% |
Demographics Similar to Spanish Americans by 10th Grade
In terms of 10th grade, the demographic groups most similar to Spanish Americans are Senegalese (93.0%, a difference of 0.030%), Uruguayan (92.9%, a difference of 0.030%), Immigrants from Cameroon (93.0%, a difference of 0.050%), Immigrants from Middle Africa (92.9%, a difference of 0.050%), and Immigrants from Somalia (93.0%, a difference of 0.060%).
| Demographics | Rating | Rank | 10th Grade |
| Immigrants | Panama | 4.3 /100 | #237 | Tragic 93.1% |
| Nigerians | 4.2 /100 | #238 | Tragic 93.1% |
| Costa Ricans | 4.2 /100 | #239 | Tragic 93.1% |
| Immigrants | Hong Kong | 4.2 /100 | #240 | Tragic 93.1% |
| Immigrants | Somalia | 2.7 /100 | #241 | Tragic 93.0% |
| Immigrants | Cameroon | 2.6 /100 | #242 | Tragic 93.0% |
| Senegalese | 2.4 /100 | #243 | Tragic 93.0% |
| Spanish Americans | 2.1 /100 | #244 | Tragic 92.9% |
| Uruguayans | 1.8 /100 | #245 | Tragic 92.9% |
| Immigrants | Middle Africa | 1.7 /100 | #246 | Tragic 92.9% |
| Immigrants | Afghanistan | 1.4 /100 | #247 | Tragic 92.8% |
| Colombians | 1.4 /100 | #248 | Tragic 92.8% |
| Immigrants | Senegal | 1.4 /100 | #249 | Tragic 92.8% |
| Jamaicans | 1.2 /100 | #250 | Tragic 92.8% |
| Immigrants | Thailand | 1.0 /100 | #251 | Tragic 92.8% |