Immigrants from Uzbekistan vs Afghan 9th Grade
COMPARE
Immigrants from Uzbekistan
Afghan
9th Grade
9th Grade Comparison
Immigrants from Uzbekistan
Afghans
93.9%
9TH GRADE
0.4/ 100
METRIC RATING
263rd/ 347
METRIC RANK
94.2%
9TH GRADE
1.8/ 100
METRIC RATING
247th/ 347
METRIC RANK
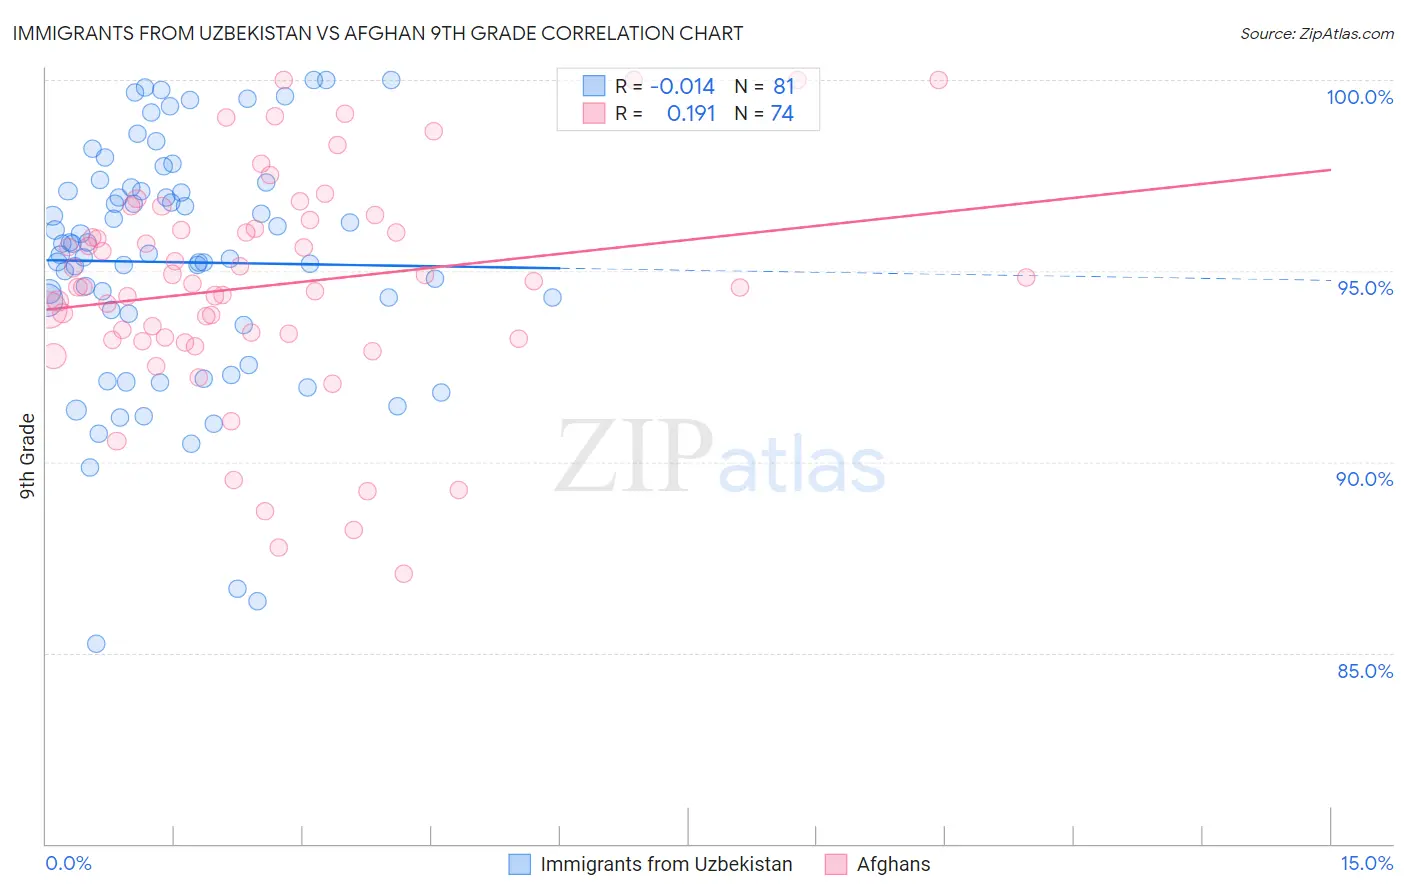
Immigrants from Uzbekistan vs Afghan 9th Grade Correlation Chart
The statistical analysis conducted on geographies consisting of 118,593,934 people shows no correlation between the proportion of Immigrants from Uzbekistan and percentage of population with at least 9th grade education in the United States with a correlation coefficient (R) of -0.014 and weighted average of 93.9%. Similarly, the statistical analysis conducted on geographies consisting of 148,851,685 people shows a poor positive correlation between the proportion of Afghans and percentage of population with at least 9th grade education in the United States with a correlation coefficient (R) of 0.191 and weighted average of 94.2%, a difference of 0.29%.
9th Grade Correlation Summary
| Measurement | Immigrants from Uzbekistan | Afghan |
| Minimum | 85.2% | 87.1% |
| Maximum | 100.0% | 100.0% |
| Range | 14.8% | 12.9% |
| Mean | 95.2% | 94.6% |
| Median | 95.5% | 94.6% |
| Interquartile 25% (IQ1) | 93.7% | 93.2% |
| Interquartile 75% (IQ3) | 97.1% | 96.1% |
| Interquartile Range (IQR) | 3.4% | 2.9% |
| Standard Deviation (Sample) | 3.2% | 2.9% |
| Standard Deviation (Population) | 3.2% | 2.9% |
Demographics Similar to Immigrants from Uzbekistan and Afghans by 9th Grade
In terms of 9th grade, the demographic groups most similar to Immigrants from Uzbekistan are Immigrants from Congo (93.9%, a difference of 0.0%), Immigrants from Jamaica (93.9%, a difference of 0.010%), Native/Alaskan (93.9%, a difference of 0.010%), South American (93.9%, a difference of 0.020%), and Pima (93.9%, a difference of 0.030%). Similarly, the demographic groups most similar to Afghans are Paiute (94.2%, a difference of 0.010%), Senegalese (94.2%, a difference of 0.010%), Immigrants from Somalia (94.1%, a difference of 0.050%), Uruguayan (94.1%, a difference of 0.060%), and Immigrants from Hong Kong (94.1%, a difference of 0.060%).
| Demographics | Rating | Rank | 9th Grade |
| Paiute | 1.9 /100 | #245 | Tragic 94.2% |
| Senegalese | 1.9 /100 | #246 | Tragic 94.2% |
| Afghans | 1.8 /100 | #247 | Tragic 94.2% |
| Immigrants | Somalia | 1.4 /100 | #248 | Tragic 94.1% |
| Uruguayans | 1.3 /100 | #249 | Tragic 94.1% |
| Immigrants | Hong Kong | 1.3 /100 | #250 | Tragic 94.1% |
| Jamaicans | 1.0 /100 | #251 | Tragic 94.1% |
| Immigrants | Senegal | 0.9 /100 | #252 | Tragic 94.1% |
| Colombians | 0.8 /100 | #253 | Tragic 94.0% |
| U.S. Virgin Islanders | 0.7 /100 | #254 | Tragic 94.0% |
| Immigrants | Nigeria | 0.6 /100 | #255 | Tragic 94.0% |
| Immigrants | Afghanistan | 0.5 /100 | #256 | Tragic 94.0% |
| Immigrants | Costa Rica | 0.5 /100 | #257 | Tragic 94.0% |
| Immigrants | Thailand | 0.5 /100 | #258 | Tragic 93.9% |
| Ghanaians | 0.5 /100 | #259 | Tragic 93.9% |
| Pima | 0.4 /100 | #260 | Tragic 93.9% |
| South Americans | 0.4 /100 | #261 | Tragic 93.9% |
| Immigrants | Jamaica | 0.4 /100 | #262 | Tragic 93.9% |
| Immigrants | Uzbekistan | 0.4 /100 | #263 | Tragic 93.9% |
| Immigrants | Congo | 0.4 /100 | #264 | Tragic 93.9% |
| Natives/Alaskans | 0.4 /100 | #265 | Tragic 93.9% |