Immigrants from Uruguay vs Immigrants from Jamaica 12th Grade, No Diploma
COMPARE
Immigrants from Uruguay
Immigrants from Jamaica
12th Grade, No Diploma
12th Grade, No Diploma Comparison
Immigrants from Uruguay
Immigrants from Jamaica
90.0%
12TH GRADE, NO DIPLOMA
1.4/ 100
METRIC RATING
245th/ 347
METRIC RANK
89.5%
12TH GRADE, NO DIPLOMA
0.2/ 100
METRIC RATING
263rd/ 347
METRIC RANK
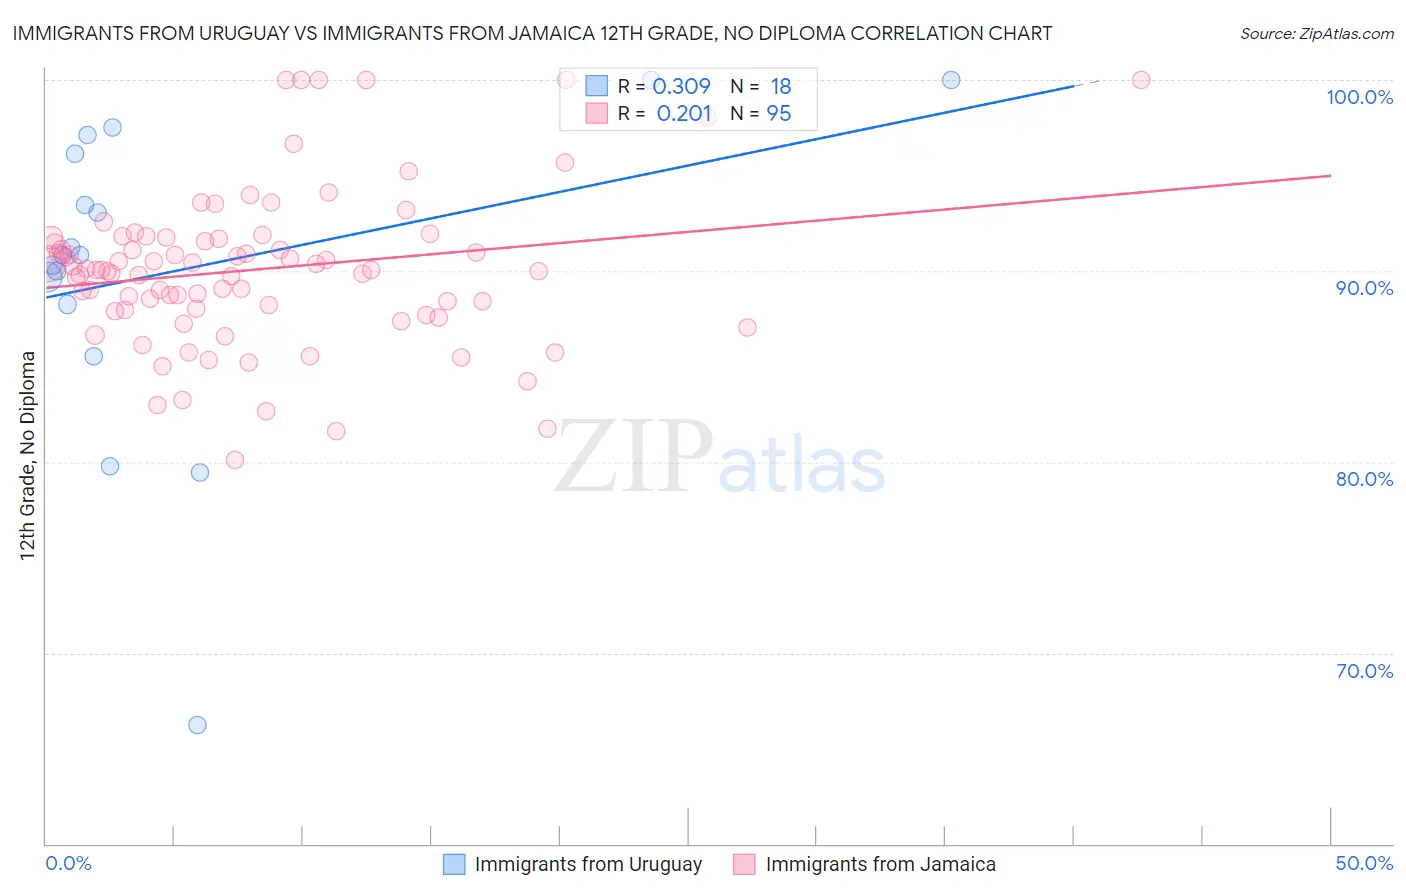
Immigrants from Uruguay vs Immigrants from Jamaica 12th Grade, No Diploma Correlation Chart
The statistical analysis conducted on geographies consisting of 133,259,667 people shows a mild positive correlation between the proportion of Immigrants from Uruguay and percentage of population with at least 12th grade (no diploma) education in the United States with a correlation coefficient (R) of 0.309 and weighted average of 90.0%. Similarly, the statistical analysis conducted on geographies consisting of 301,829,550 people shows a weak positive correlation between the proportion of Immigrants from Jamaica and percentage of population with at least 12th grade (no diploma) education in the United States with a correlation coefficient (R) of 0.201 and weighted average of 89.5%, a difference of 0.55%.
12th Grade, No Diploma Correlation Summary
| Measurement | Immigrants from Uruguay | Immigrants from Jamaica |
| Minimum | 66.2% | 80.1% |
| Maximum | 100.0% | 100.0% |
| Range | 33.8% | 19.9% |
| Mean | 90.0% | 90.1% |
| Median | 90.8% | 90.1% |
| Interquartile 25% (IQ1) | 88.3% | 88.0% |
| Interquartile 75% (IQ3) | 96.1% | 91.8% |
| Interquartile Range (IQR) | 7.9% | 3.8% |
| Standard Deviation (Sample) | 8.3% | 4.1% |
| Standard Deviation (Population) | 8.1% | 4.1% |
Demographics Similar to Immigrants from Uruguay and Immigrants from Jamaica by 12th Grade, No Diploma
In terms of 12th grade, no diploma, the demographic groups most similar to Immigrants from Uruguay are Ghanaian (90.0%, a difference of 0.010%), Immigrants from Nigeria (89.9%, a difference of 0.020%), Taiwanese (90.0%, a difference of 0.040%), Comanche (89.9%, a difference of 0.070%), and Senegalese (89.9%, a difference of 0.080%). Similarly, the demographic groups most similar to Immigrants from Jamaica are Sri Lankan (89.4%, a difference of 0.040%), Cheyenne (89.6%, a difference of 0.14%), Sioux (89.6%, a difference of 0.14%), Immigrants from South Eastern Asia (89.6%, a difference of 0.15%), and Immigrants from Western Africa (89.6%, a difference of 0.16%).
| Demographics | Rating | Rank | 12th Grade, No Diploma |
| Taiwanese | 1.5 /100 | #244 | Tragic 90.0% |
| Immigrants | Uruguay | 1.4 /100 | #245 | Tragic 90.0% |
| Ghanaians | 1.3 /100 | #246 | Tragic 90.0% |
| Immigrants | Nigeria | 1.3 /100 | #247 | Tragic 89.9% |
| Comanche | 1.1 /100 | #248 | Tragic 89.9% |
| Senegalese | 1.1 /100 | #249 | Tragic 89.9% |
| Immigrants | Eritrea | 1.0 /100 | #250 | Tragic 89.9% |
| Spanish Americans | 0.9 /100 | #251 | Tragic 89.9% |
| Bahamians | 0.9 /100 | #252 | Tragic 89.9% |
| Choctaw | 0.7 /100 | #253 | Tragic 89.8% |
| Immigrants | Peru | 0.5 /100 | #254 | Tragic 89.7% |
| Immigrants | Senegal | 0.5 /100 | #255 | Tragic 89.7% |
| Immigrants | Ghana | 0.5 /100 | #256 | Tragic 89.7% |
| Jamaicans | 0.5 /100 | #257 | Tragic 89.7% |
| Africans | 0.4 /100 | #258 | Tragic 89.6% |
| Immigrants | Western Africa | 0.4 /100 | #259 | Tragic 89.6% |
| Immigrants | South Eastern Asia | 0.4 /100 | #260 | Tragic 89.6% |
| Cheyenne | 0.4 /100 | #261 | Tragic 89.6% |
| Sioux | 0.4 /100 | #262 | Tragic 89.6% |
| Immigrants | Jamaica | 0.2 /100 | #263 | Tragic 89.5% |
| Sri Lankans | 0.2 /100 | #264 | Tragic 89.4% |