Immigrants from Uganda vs Peruvian Master's Degree
COMPARE
Immigrants from Uganda
Peruvian
Master's Degree
Master's Degree Comparison
Immigrants from Uganda
Peruvians
16.6%
MASTER'S DEGREE
97.3/ 100
METRIC RATING
115th/ 347
METRIC RANK
15.3%
MASTER'S DEGREE
68.7/ 100
METRIC RATING
162nd/ 347
METRIC RANK
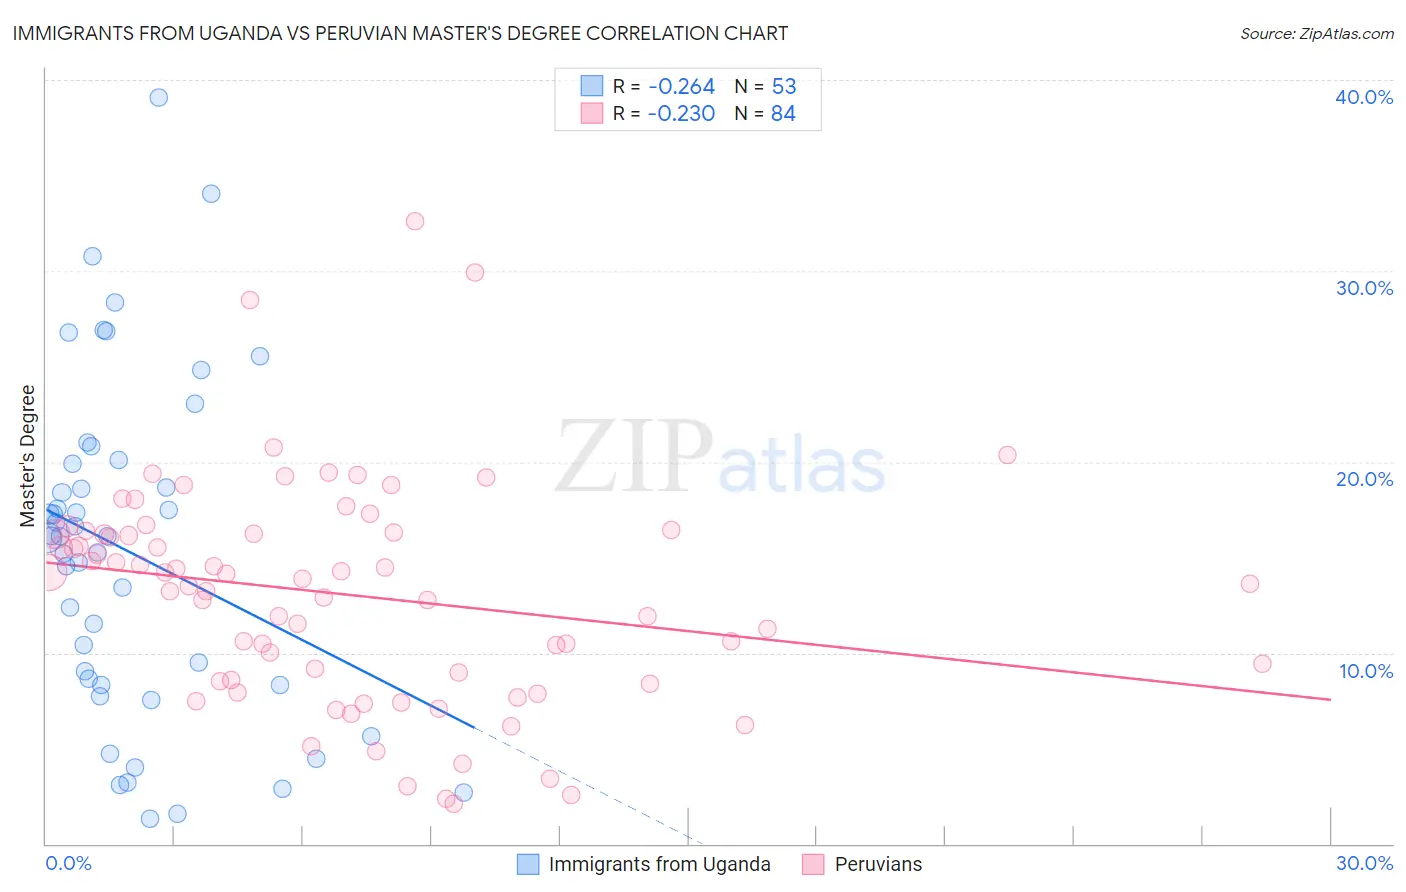
Immigrants from Uganda vs Peruvian Master's Degree Correlation Chart
The statistical analysis conducted on geographies consisting of 125,956,519 people shows a weak negative correlation between the proportion of Immigrants from Uganda and percentage of population with at least master's degree education in the United States with a correlation coefficient (R) of -0.264 and weighted average of 16.6%. Similarly, the statistical analysis conducted on geographies consisting of 363,142,286 people shows a weak negative correlation between the proportion of Peruvians and percentage of population with at least master's degree education in the United States with a correlation coefficient (R) of -0.230 and weighted average of 15.3%, a difference of 8.8%.
Master's Degree Correlation Summary
| Measurement | Immigrants from Uganda | Peruvian |
| Minimum | 1.3% | 2.1% |
| Maximum | 39.1% | 32.6% |
| Range | 37.8% | 30.5% |
| Mean | 15.3% | 13.1% |
| Median | 16.1% | 13.8% |
| Interquartile 25% (IQ1) | 8.3% | 8.6% |
| Interquartile 75% (IQ3) | 20.0% | 16.3% |
| Interquartile Range (IQR) | 11.7% | 7.7% |
| Standard Deviation (Sample) | 8.7% | 5.8% |
| Standard Deviation (Population) | 8.7% | 5.8% |
Similar Demographics by Master's Degree
Demographics Similar to Immigrants from Uganda by Master's Degree
In terms of master's degree, the demographic groups most similar to Immigrants from Uganda are Immigrants from Southern Europe (16.6%, a difference of 0.12%), Immigrants from Moldova (16.6%, a difference of 0.13%), Northern European (16.7%, a difference of 0.30%), Arab (16.7%, a difference of 0.37%), and Macedonian (16.7%, a difference of 0.38%).
| Demographics | Rating | Rank | Master's Degree |
| Sierra Leoneans | 98.0 /100 | #108 | Exceptional 16.8% |
| Moroccans | 98.0 /100 | #109 | Exceptional 16.8% |
| Immigrants | Chile | 98.0 /100 | #110 | Exceptional 16.8% |
| Austrians | 97.8 /100 | #111 | Exceptional 16.7% |
| Macedonians | 97.7 /100 | #112 | Exceptional 16.7% |
| Arabs | 97.7 /100 | #113 | Exceptional 16.7% |
| Northern Europeans | 97.6 /100 | #114 | Exceptional 16.7% |
| Immigrants | Uganda | 97.3 /100 | #115 | Exceptional 16.6% |
| Immigrants | Southern Europe | 97.2 /100 | #116 | Exceptional 16.6% |
| Immigrants | Moldova | 97.2 /100 | #117 | Exceptional 16.6% |
| Brazilians | 96.8 /100 | #118 | Exceptional 16.5% |
| Jordanians | 96.5 /100 | #119 | Exceptional 16.5% |
| Lebanese | 96.4 /100 | #120 | Exceptional 16.5% |
| Afghans | 96.2 /100 | #121 | Exceptional 16.5% |
| British | 95.6 /100 | #122 | Exceptional 16.4% |
Demographics Similar to Peruvians by Master's Degree
In terms of master's degree, the demographic groups most similar to Peruvians are Sudanese (15.3%, a difference of 0.010%), Uruguayan (15.3%, a difference of 0.22%), Kenyan (15.3%, a difference of 0.24%), Colombian (15.3%, a difference of 0.25%), and Immigrants from Kenya (15.3%, a difference of 0.29%).
| Demographics | Rating | Rank | Master's Degree |
| Immigrants | Bangladesh | 76.1 /100 | #155 | Good 15.5% |
| Bermudans | 73.9 /100 | #156 | Good 15.4% |
| Immigrants | Cameroon | 71.7 /100 | #157 | Good 15.4% |
| Immigrants | Poland | 71.5 /100 | #158 | Good 15.4% |
| Luxembourgers | 71.0 /100 | #159 | Good 15.3% |
| Kenyans | 70.3 /100 | #160 | Good 15.3% |
| Sudanese | 68.7 /100 | #161 | Good 15.3% |
| Peruvians | 68.7 /100 | #162 | Good 15.3% |
| Uruguayans | 67.1 /100 | #163 | Good 15.3% |
| Colombians | 66.9 /100 | #164 | Good 15.3% |
| Immigrants | Kenya | 66.6 /100 | #165 | Good 15.3% |
| Swedes | 66.1 /100 | #166 | Good 15.2% |
| Senegalese | 65.6 /100 | #167 | Good 15.2% |
| Immigrants | North Macedonia | 64.5 /100 | #168 | Good 15.2% |
| Scottish | 62.7 /100 | #169 | Good 15.2% |