Immigrants from Trinidad and Tobago vs Assyrian/Chaldean/Syriac Professional Degree
COMPARE
Immigrants from Trinidad and Tobago
Assyrian/Chaldean/Syriac
Professional Degree
Professional Degree Comparison
Immigrants from Trinidad and Tobago
Assyrians/Chaldeans/Syriacs
3.9%
PROFESSIONAL DEGREE
3.8/ 100
METRIC RATING
237th/ 347
METRIC RANK
4.5%
PROFESSIONAL DEGREE
67.4/ 100
METRIC RATING
161st/ 347
METRIC RANK
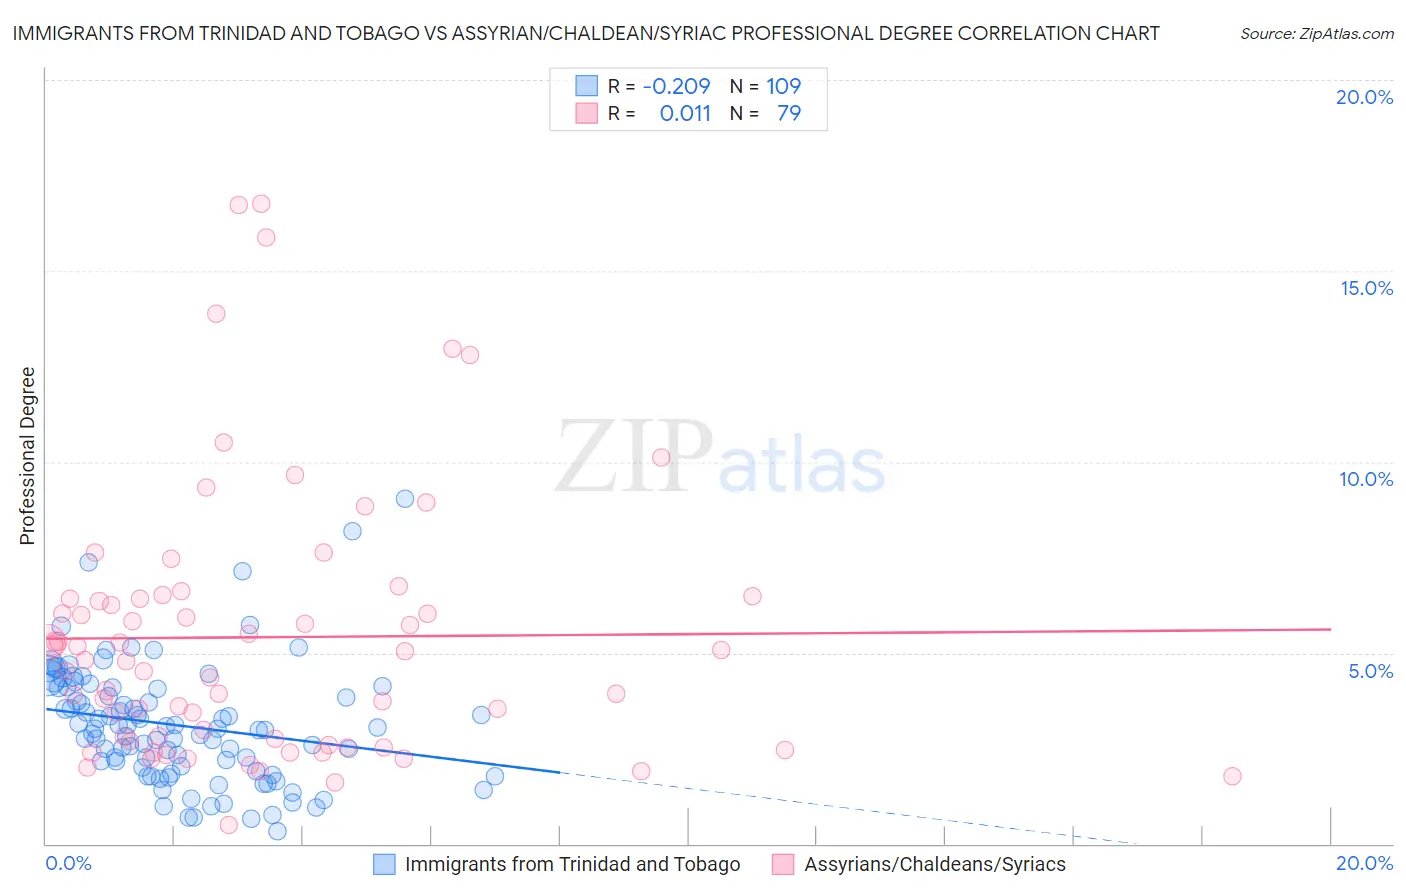
Immigrants from Trinidad and Tobago vs Assyrian/Chaldean/Syriac Professional Degree Correlation Chart
The statistical analysis conducted on geographies consisting of 223,309,655 people shows a weak negative correlation between the proportion of Immigrants from Trinidad and Tobago and percentage of population with at least professional degree education in the United States with a correlation coefficient (R) of -0.209 and weighted average of 3.9%. Similarly, the statistical analysis conducted on geographies consisting of 110,257,052 people shows no correlation between the proportion of Assyrians/Chaldeans/Syriacs and percentage of population with at least professional degree education in the United States with a correlation coefficient (R) of 0.011 and weighted average of 4.5%, a difference of 16.3%.
Professional Degree Correlation Summary
| Measurement | Immigrants from Trinidad and Tobago | Assyrian/Chaldean/Syriac |
| Minimum | 0.34% | 0.50% |
| Maximum | 9.0% | 16.8% |
| Range | 8.7% | 16.3% |
| Mean | 3.1% | 5.4% |
| Median | 3.0% | 4.8% |
| Interquartile 25% (IQ1) | 1.9% | 2.7% |
| Interquartile 75% (IQ3) | 4.1% | 6.4% |
| Interquartile Range (IQR) | 2.2% | 3.7% |
| Standard Deviation (Sample) | 1.6% | 3.5% |
| Standard Deviation (Population) | 1.6% | 3.5% |
Similar Demographics by Professional Degree
Demographics Similar to Immigrants from Trinidad and Tobago by Professional Degree
In terms of professional degree, the demographic groups most similar to Immigrants from Trinidad and Tobago are Spanish American (3.9%, a difference of 0.070%), Immigrants from Barbados (3.9%, a difference of 0.29%), Nonimmigrants (3.9%, a difference of 0.30%), Immigrants from Philippines (3.9%, a difference of 0.34%), and Cree (3.9%, a difference of 0.60%).
| Demographics | Rating | Rank | Professional Degree |
| Nicaraguans | 5.1 /100 | #230 | Tragic 3.9% |
| Ecuadorians | 4.6 /100 | #231 | Tragic 3.9% |
| Cree | 4.3 /100 | #232 | Tragic 3.9% |
| Immigrants | Philippines | 4.1 /100 | #233 | Tragic 3.9% |
| Immigrants | Nonimmigrants | 4.0 /100 | #234 | Tragic 3.9% |
| Immigrants | Barbados | 4.0 /100 | #235 | Tragic 3.9% |
| Spanish Americans | 3.8 /100 | #236 | Tragic 3.9% |
| Immigrants | Trinidad and Tobago | 3.8 /100 | #237 | Tragic 3.9% |
| Colville | 2.6 /100 | #238 | Tragic 3.8% |
| British West Indians | 2.4 /100 | #239 | Tragic 3.8% |
| Immigrants | Ecuador | 2.3 /100 | #240 | Tragic 3.8% |
| Alaskan Athabascans | 2.3 /100 | #241 | Tragic 3.8% |
| Native Hawaiians | 2.3 /100 | #242 | Tragic 3.8% |
| Guamanians/Chamorros | 2.2 /100 | #243 | Tragic 3.8% |
| Immigrants | Bahamas | 2.0 /100 | #244 | Tragic 3.8% |
Demographics Similar to Assyrians/Chaldeans/Syriacs by Professional Degree
In terms of professional degree, the demographic groups most similar to Assyrians/Chaldeans/Syriacs are Immigrants from Senegal (4.5%, a difference of 0.10%), Vietnamese (4.5%, a difference of 0.16%), Immigrants from Armenia (4.5%, a difference of 0.24%), Peruvian (4.5%, a difference of 0.34%), and Iraqi (4.5%, a difference of 0.41%).
| Demographics | Rating | Rank | Professional Degree |
| Scottish | 71.8 /100 | #154 | Good 4.6% |
| Slavs | 70.8 /100 | #155 | Good 4.5% |
| Swedes | 69.9 /100 | #156 | Good 4.5% |
| Iraqis | 69.8 /100 | #157 | Good 4.5% |
| Immigrants | Armenia | 68.8 /100 | #158 | Good 4.5% |
| Vietnamese | 68.4 /100 | #159 | Good 4.5% |
| Immigrants | Senegal | 68.0 /100 | #160 | Good 4.5% |
| Assyrians/Chaldeans/Syriacs | 67.4 /100 | #161 | Good 4.5% |
| Peruvians | 65.2 /100 | #162 | Good 4.5% |
| Sierra Leoneans | 64.3 /100 | #163 | Good 4.5% |
| Swiss | 61.0 /100 | #164 | Good 4.5% |
| Costa Ricans | 59.9 /100 | #165 | Average 4.5% |
| Immigrants | Colombia | 59.4 /100 | #166 | Average 4.5% |
| Immigrants | Afghanistan | 59.2 /100 | #167 | Average 4.5% |
| Immigrants | Sierra Leone | 58.7 /100 | #168 | Average 4.5% |